Informa Markets organizes events and trade shows for various industries such as Agriculture, Aviation, Art, Energy, Healthcare. They wanted to understand how to provide more value to their corporate customers, after an event has ended such as quality leads that have a high probability of conversion.
Brief
“Design a new B2B product that customers will pay extra for. We’re first to market.”
What it became
A product and business pivot around what the evidence actually said.
Impact for business
The premium data tier was cancelled before build. Revenue moved from charging twice for the same event to charging for the analysis.
Impact for users
Customers stopped being sold data they’d already paid for, and got the thing they kept asking for: one view of a lead’s full history.
They weren’t first to market
Four established platforms already did pieces of their idea, buried under features these customers didn’t want. So we stopped competing on feature count and defined value by insight quality instead.
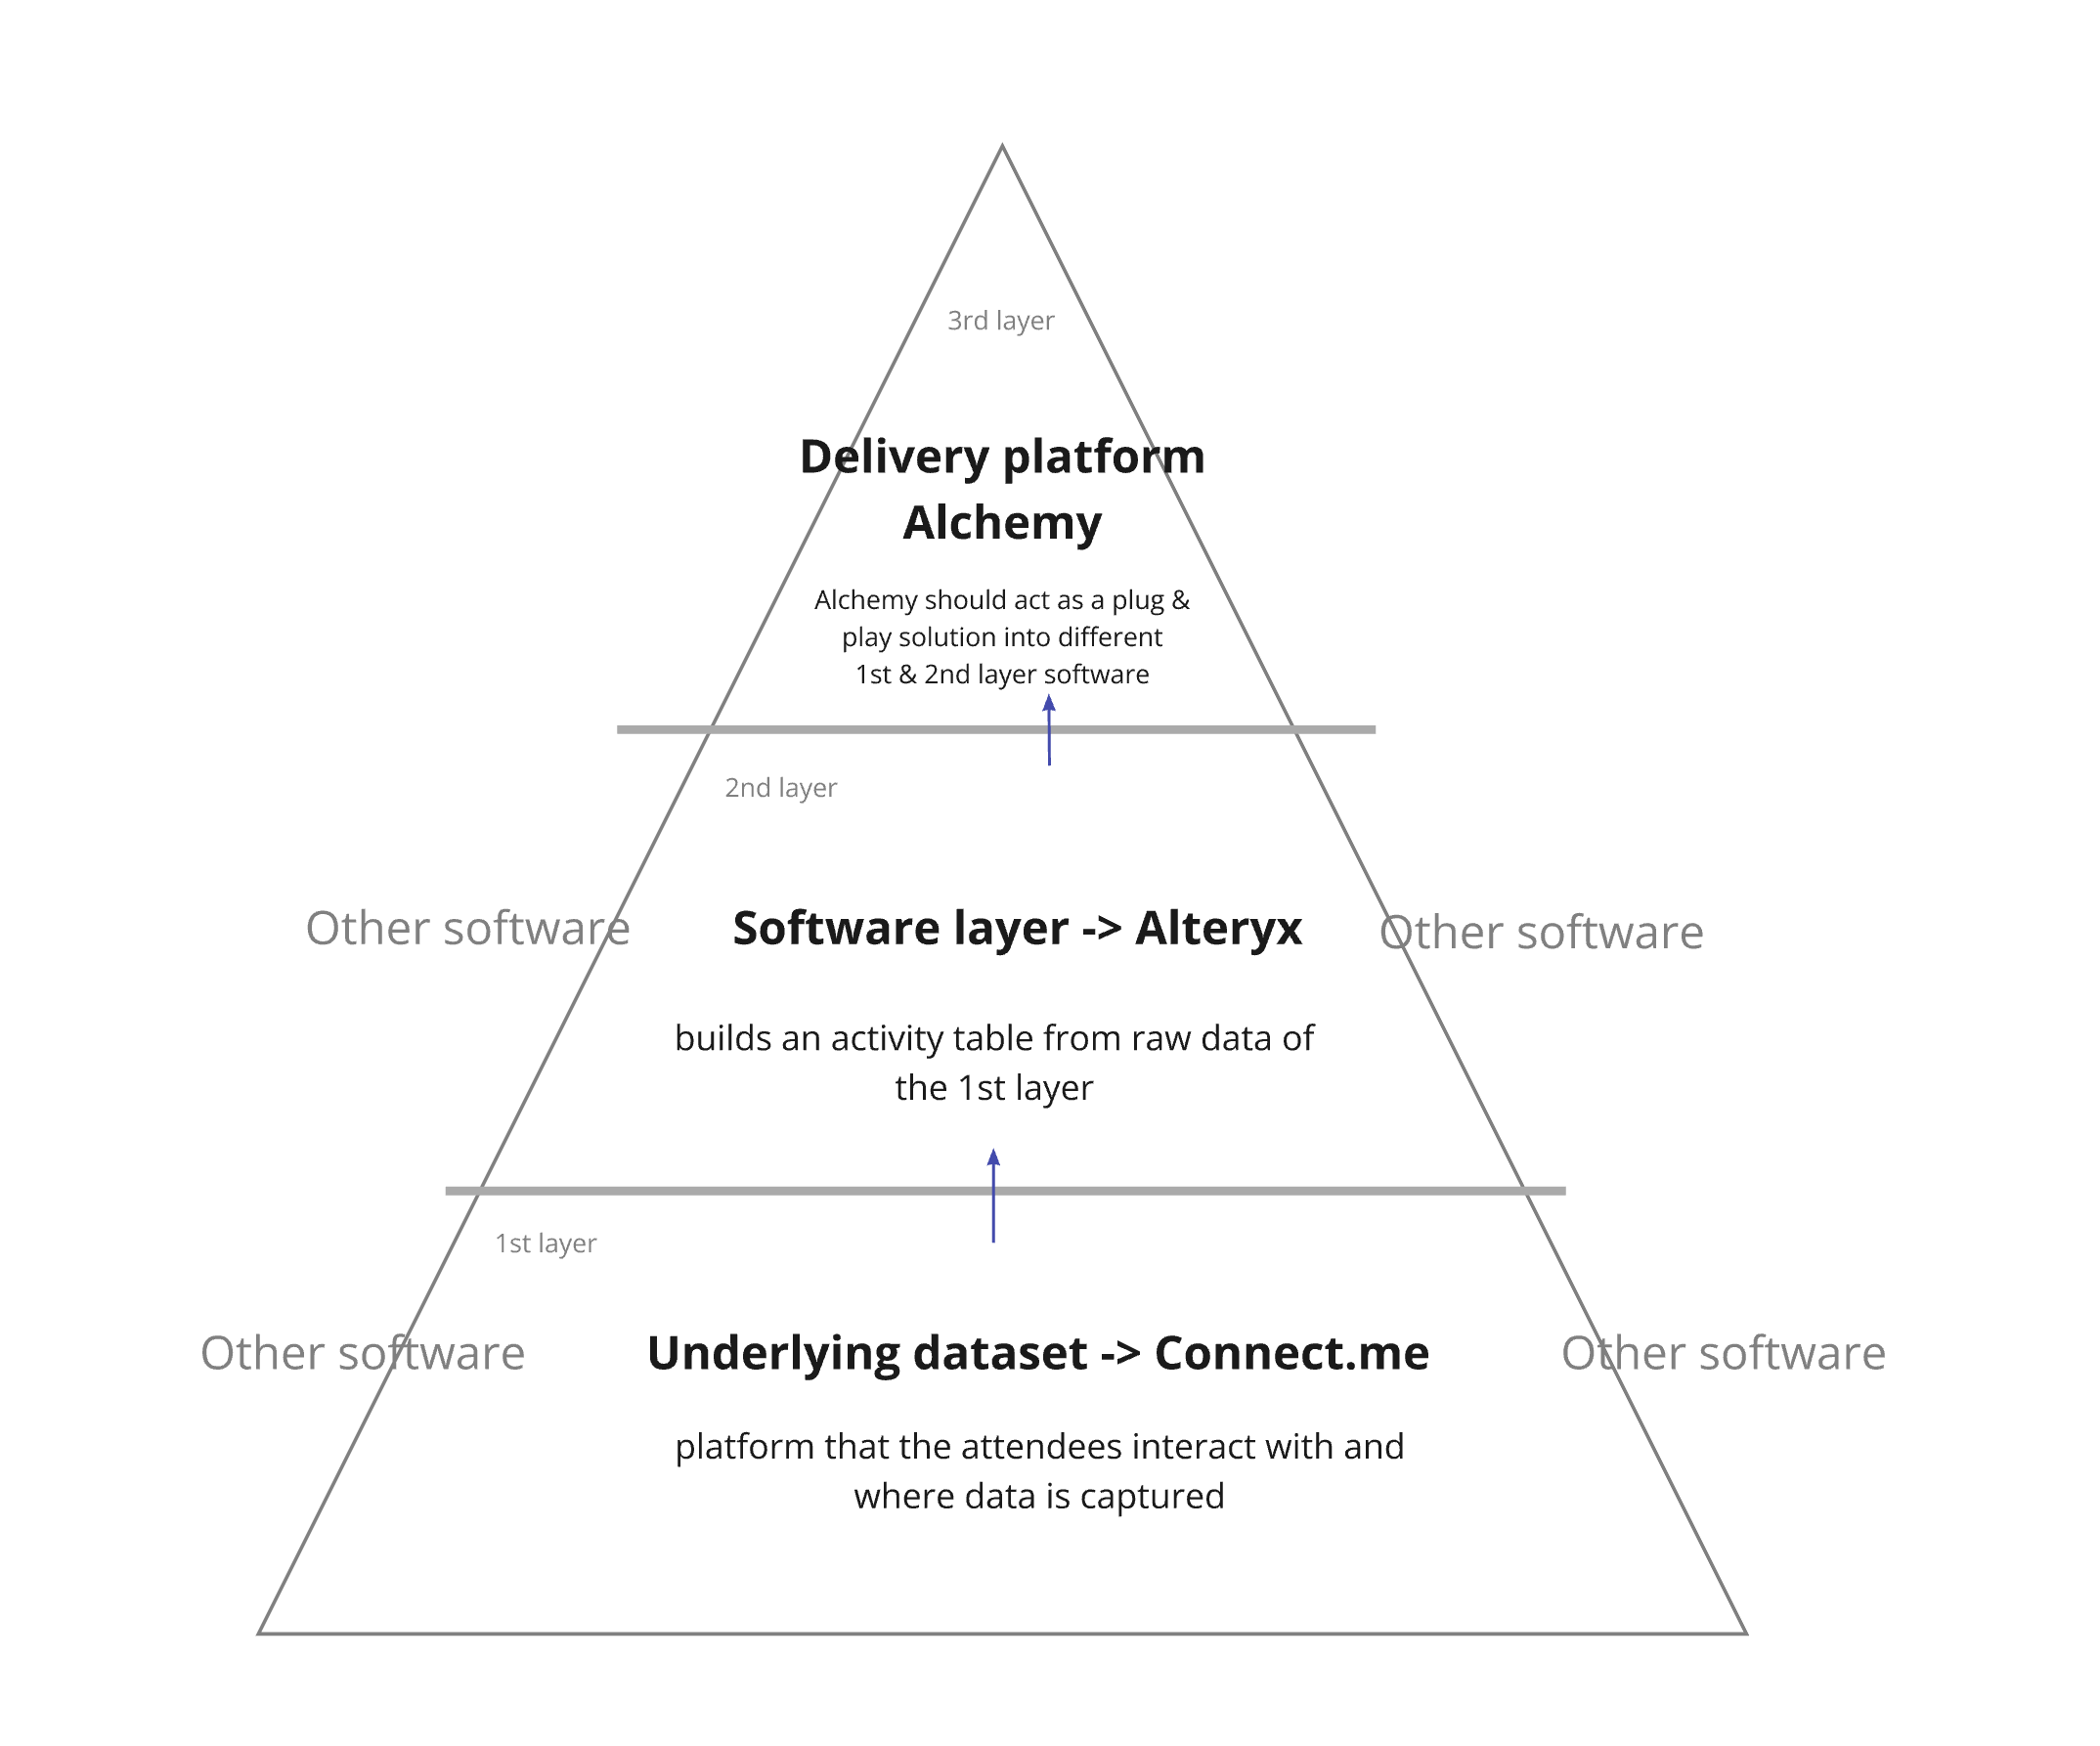
The original platform
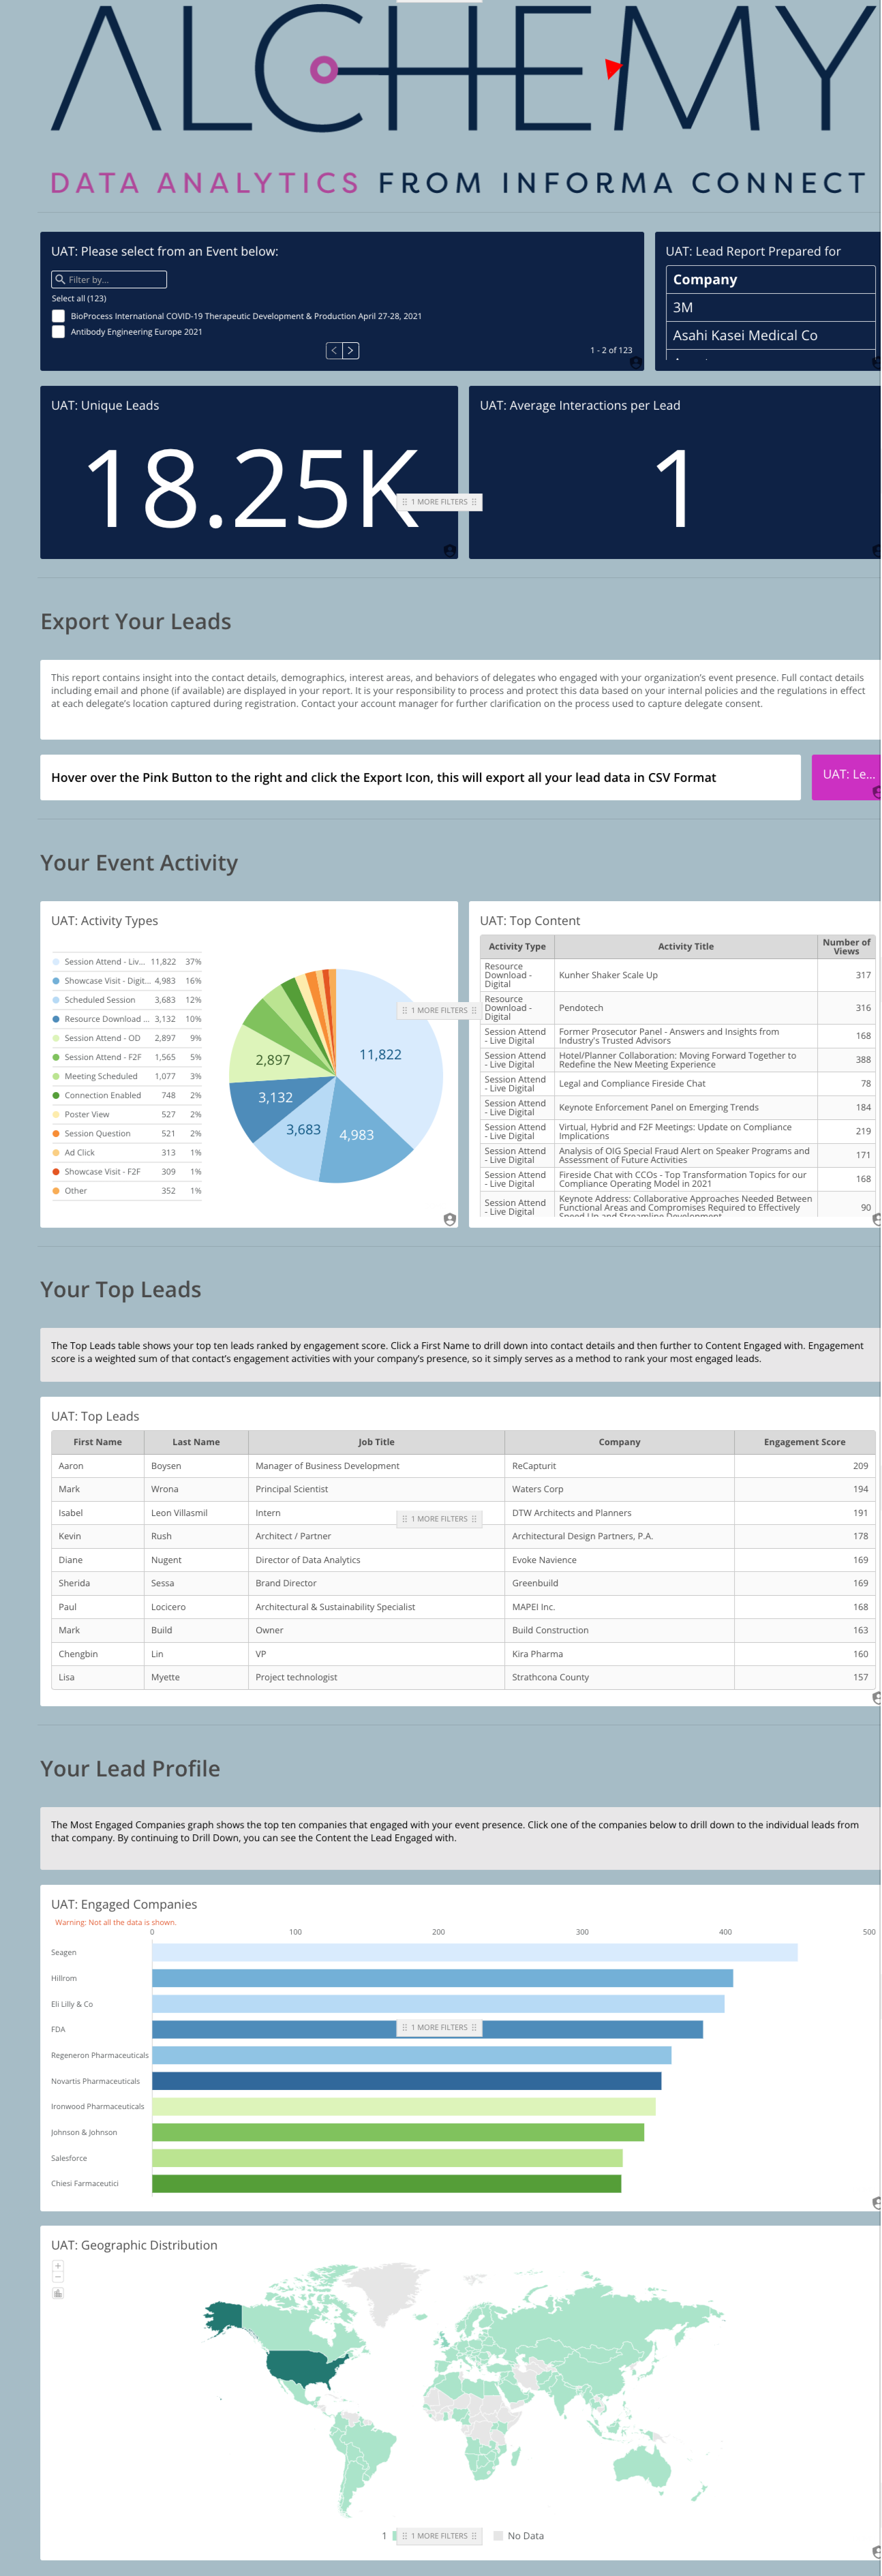
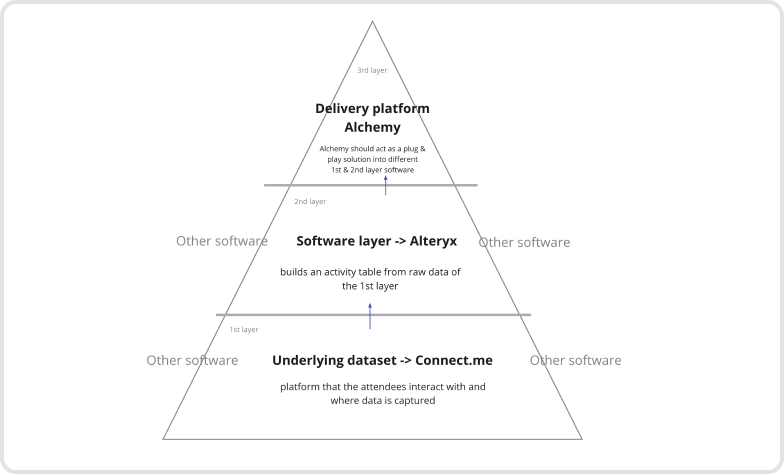
I mapped the platform’s original architecture, then traced how data moved across the wider ecosystem, from the systems capturing raw attendee data at an event to the one displaying leads. That showed which data points mattered across an event’s lifecycle, and where they were being lost.
Competitor analysis
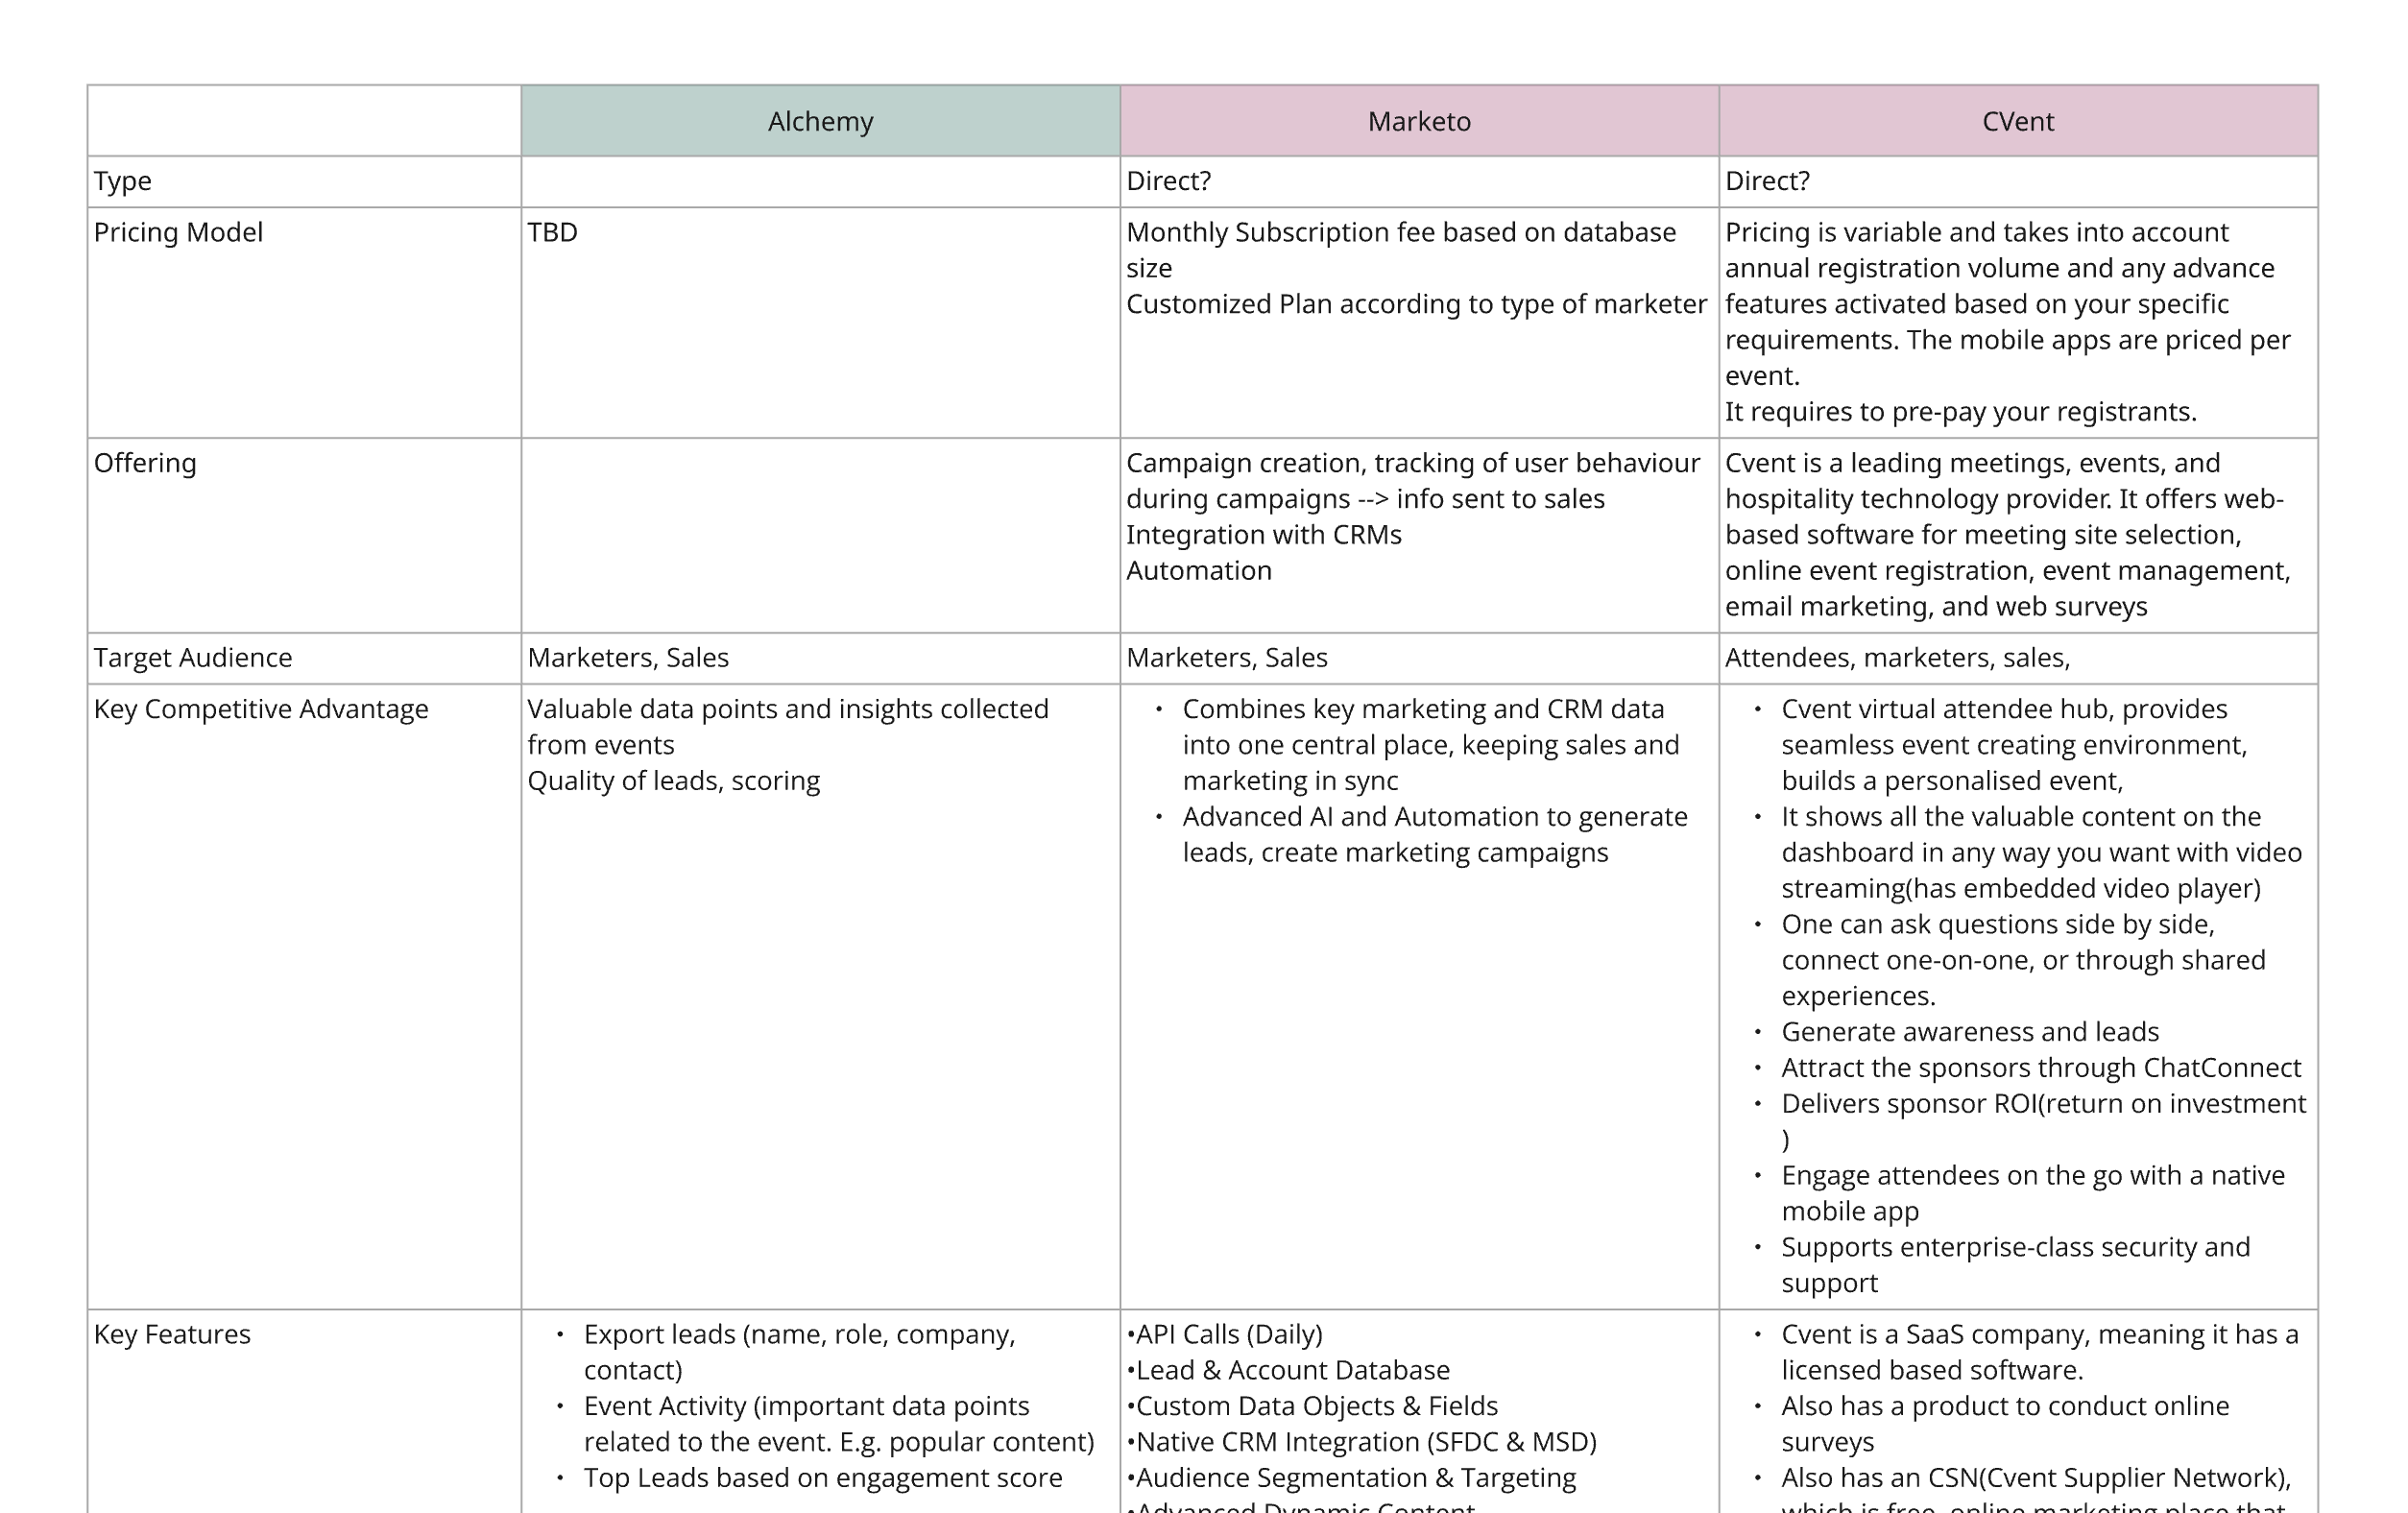
In parallel I ran a competitor analysis with the PM. Marketo, Oracle, Eloqua and CVent already did parts of this, scattered across suites offering far more than these customers needed. That gap defined the opening: a focused product, not another suite.
Pre-mortem workshop
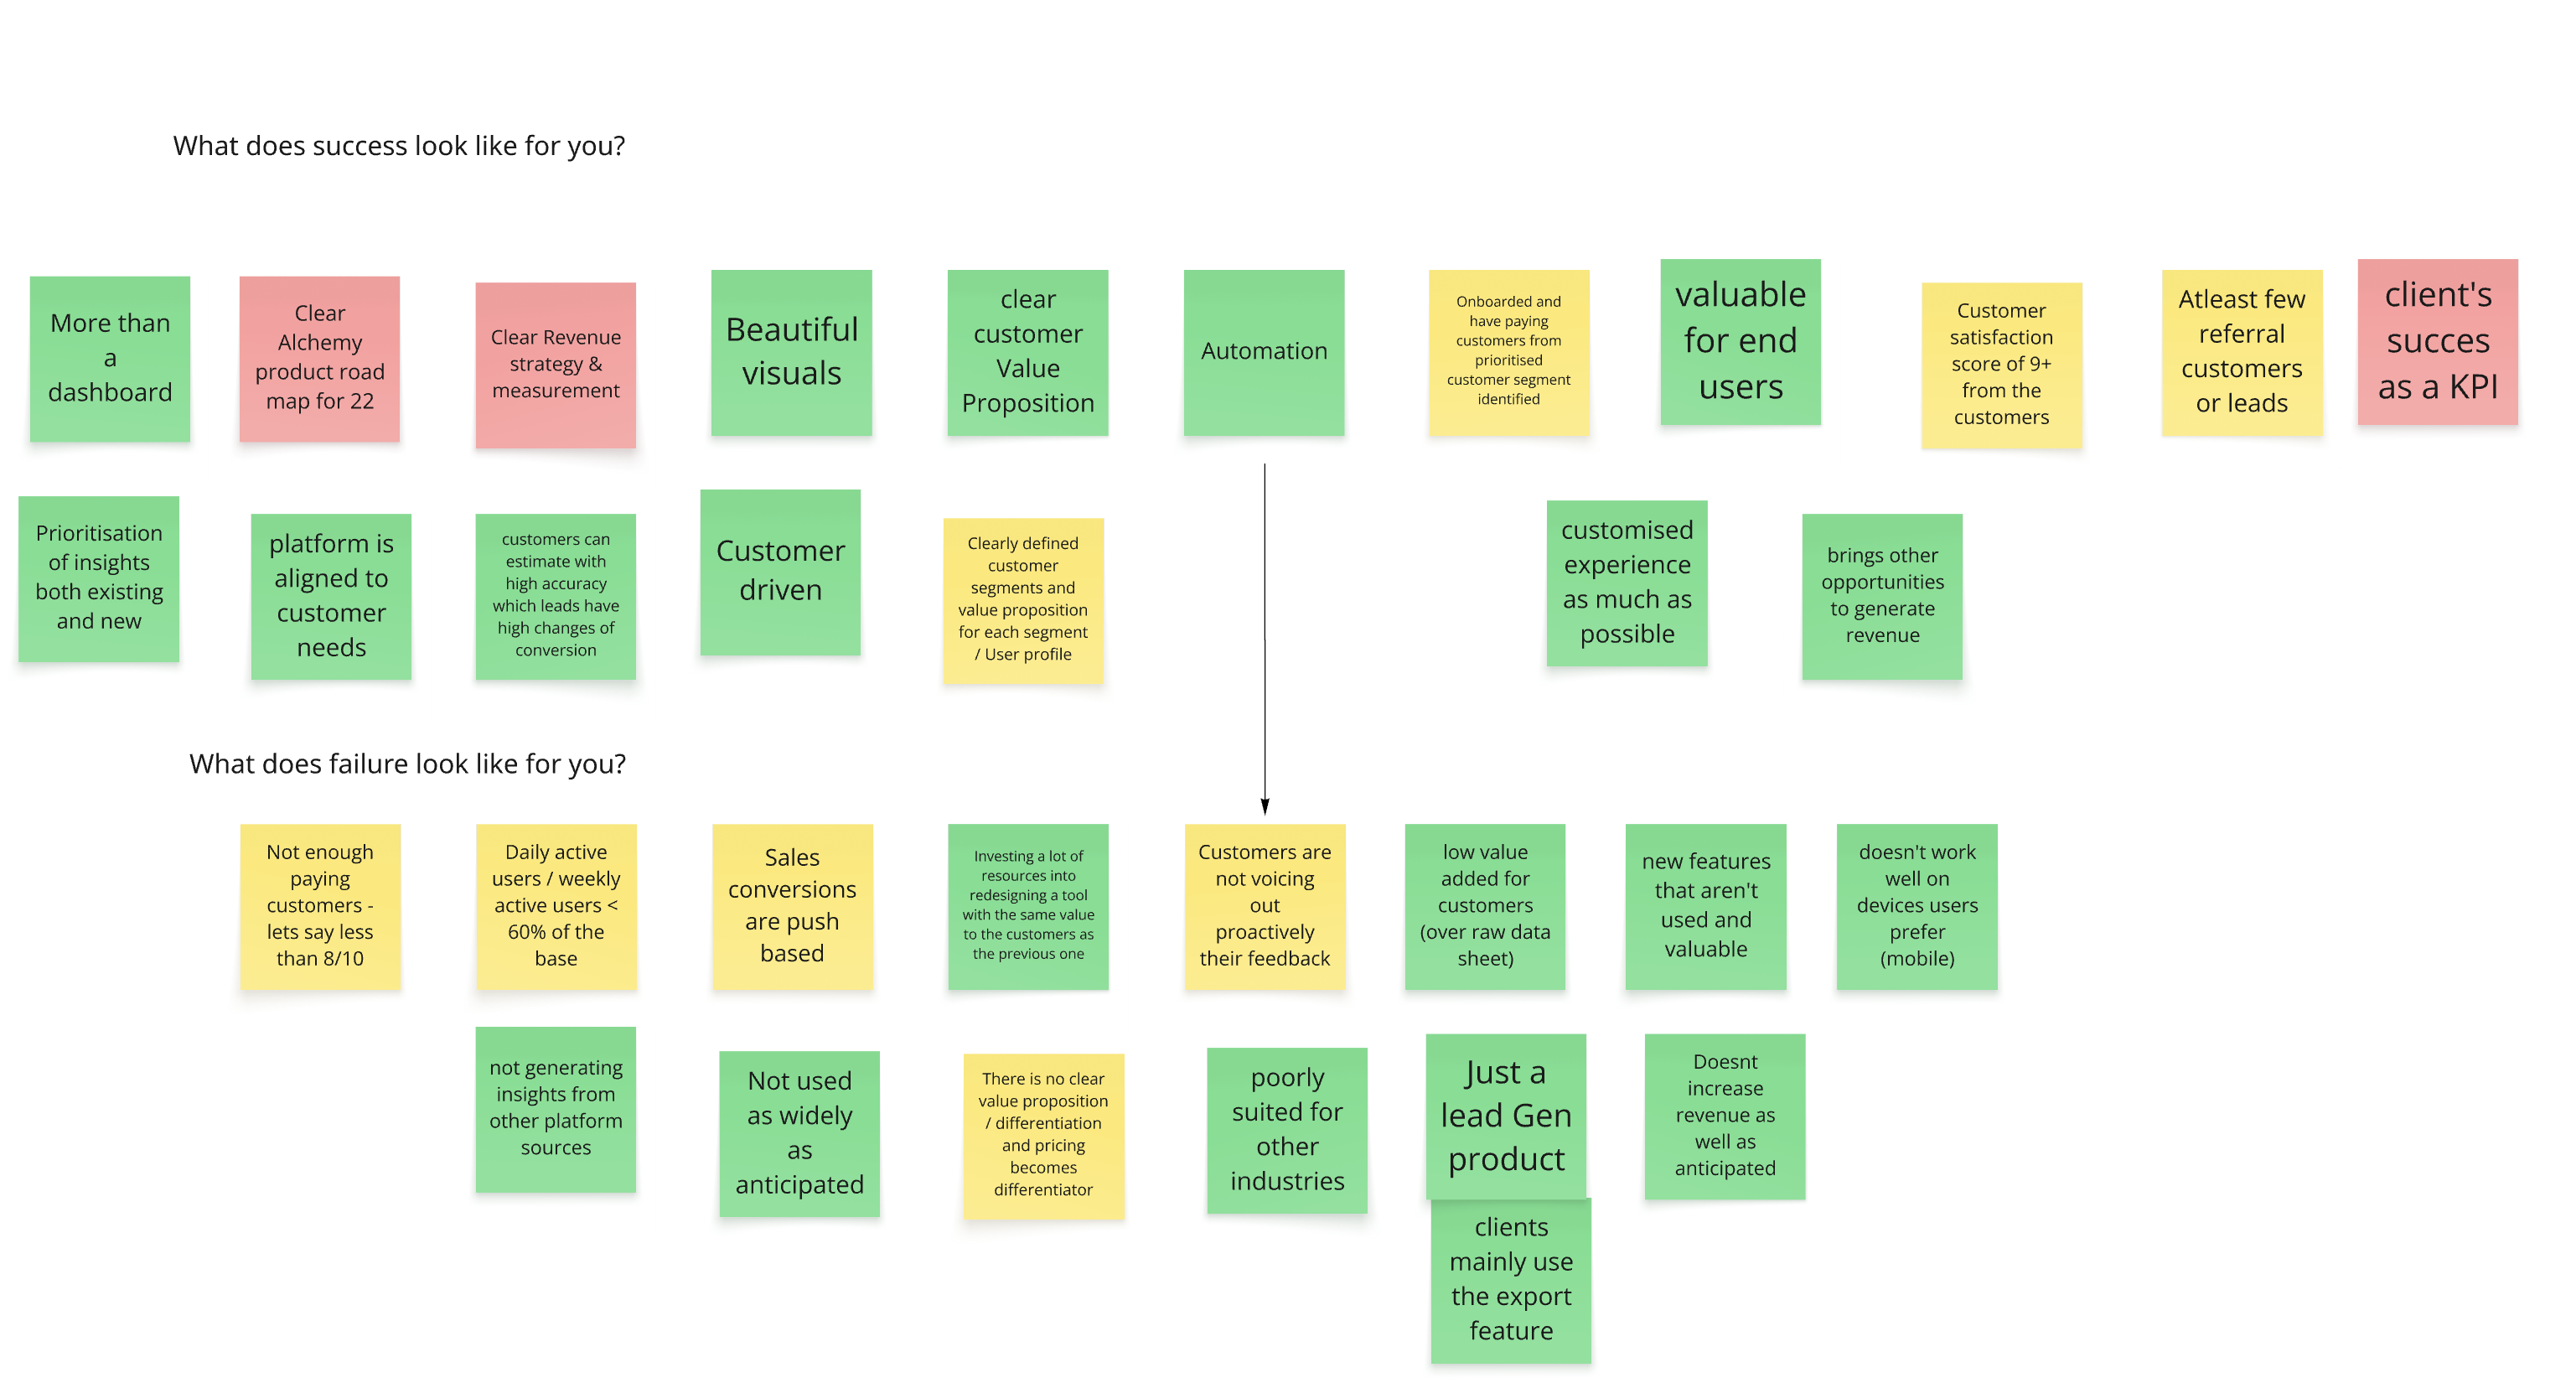
During a pre-mortem workshop with the client, we managed to surface the question the whole project hinged on: “Is it viable to make it more than a simple dashboard where customers only export the data?” It also set the bar for success: more accurate signals of which leads convert, revenue beyond in-person events, and weekly active users at 60% or more of the user base.
Nobody would pay extra
Customers had already paid to exhibit. In their view the post-event data was part of that. The premium tier died in discovery, and the revenue model moved with it.
Discovery research
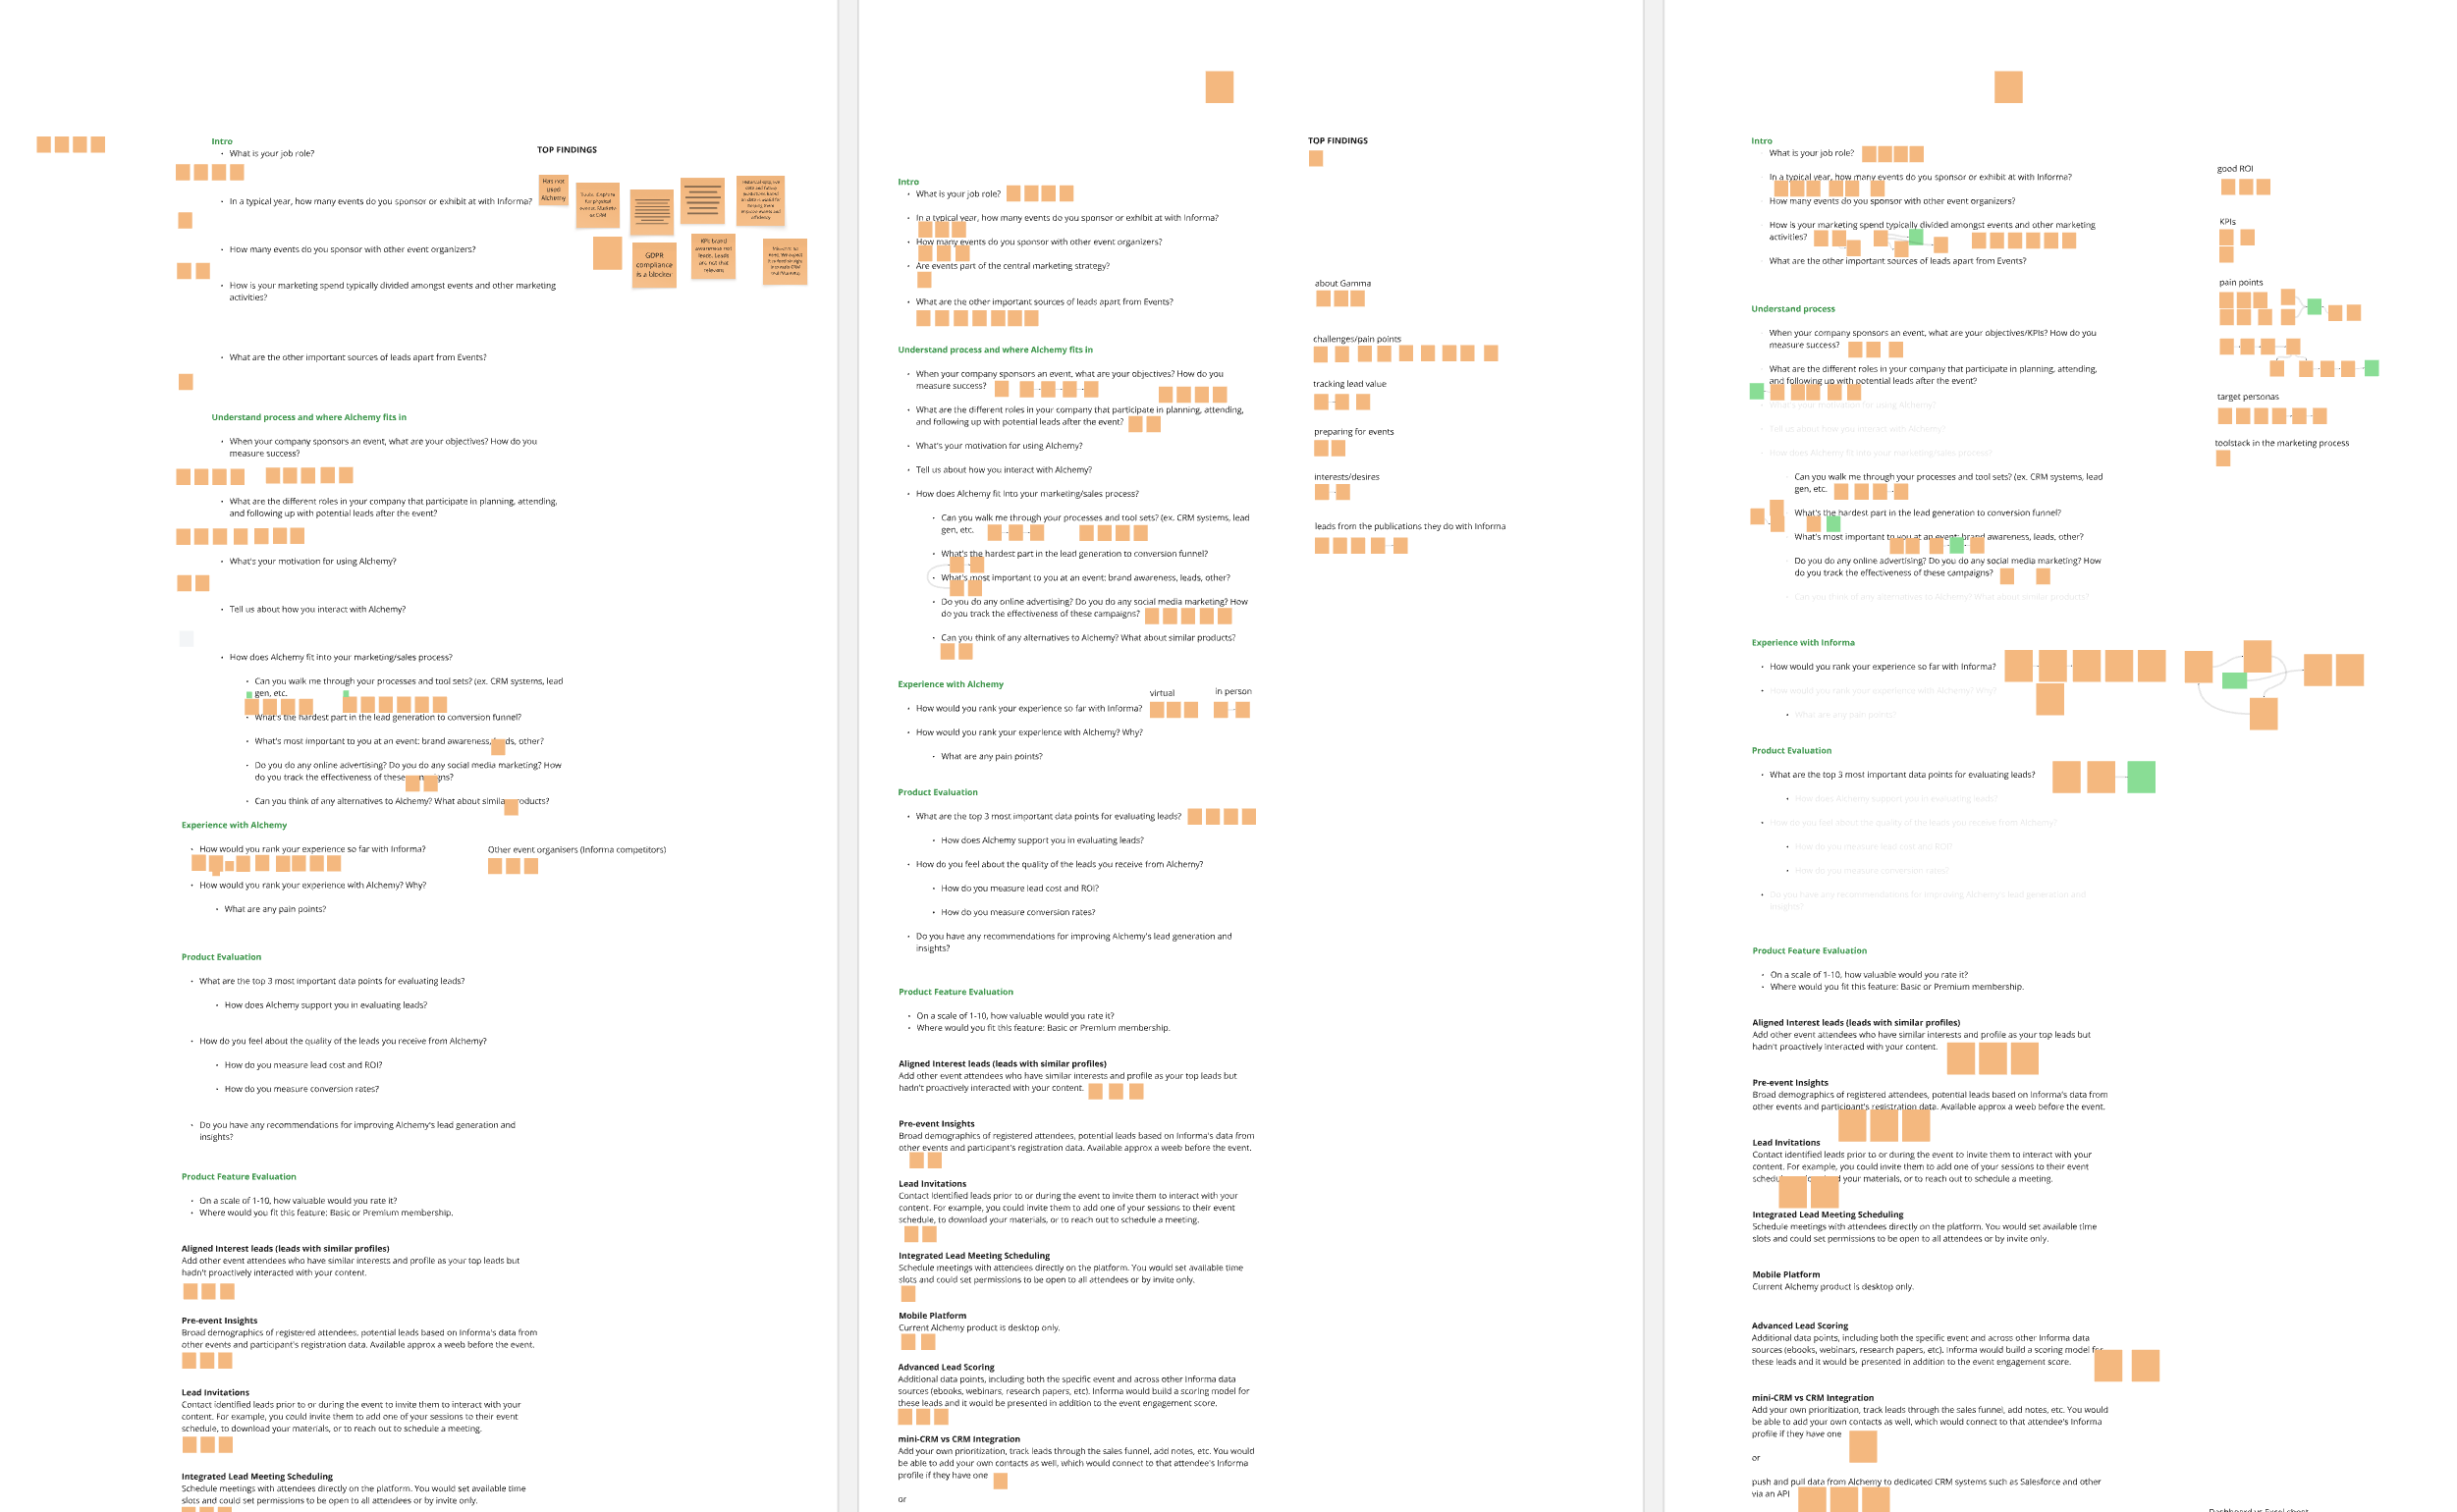
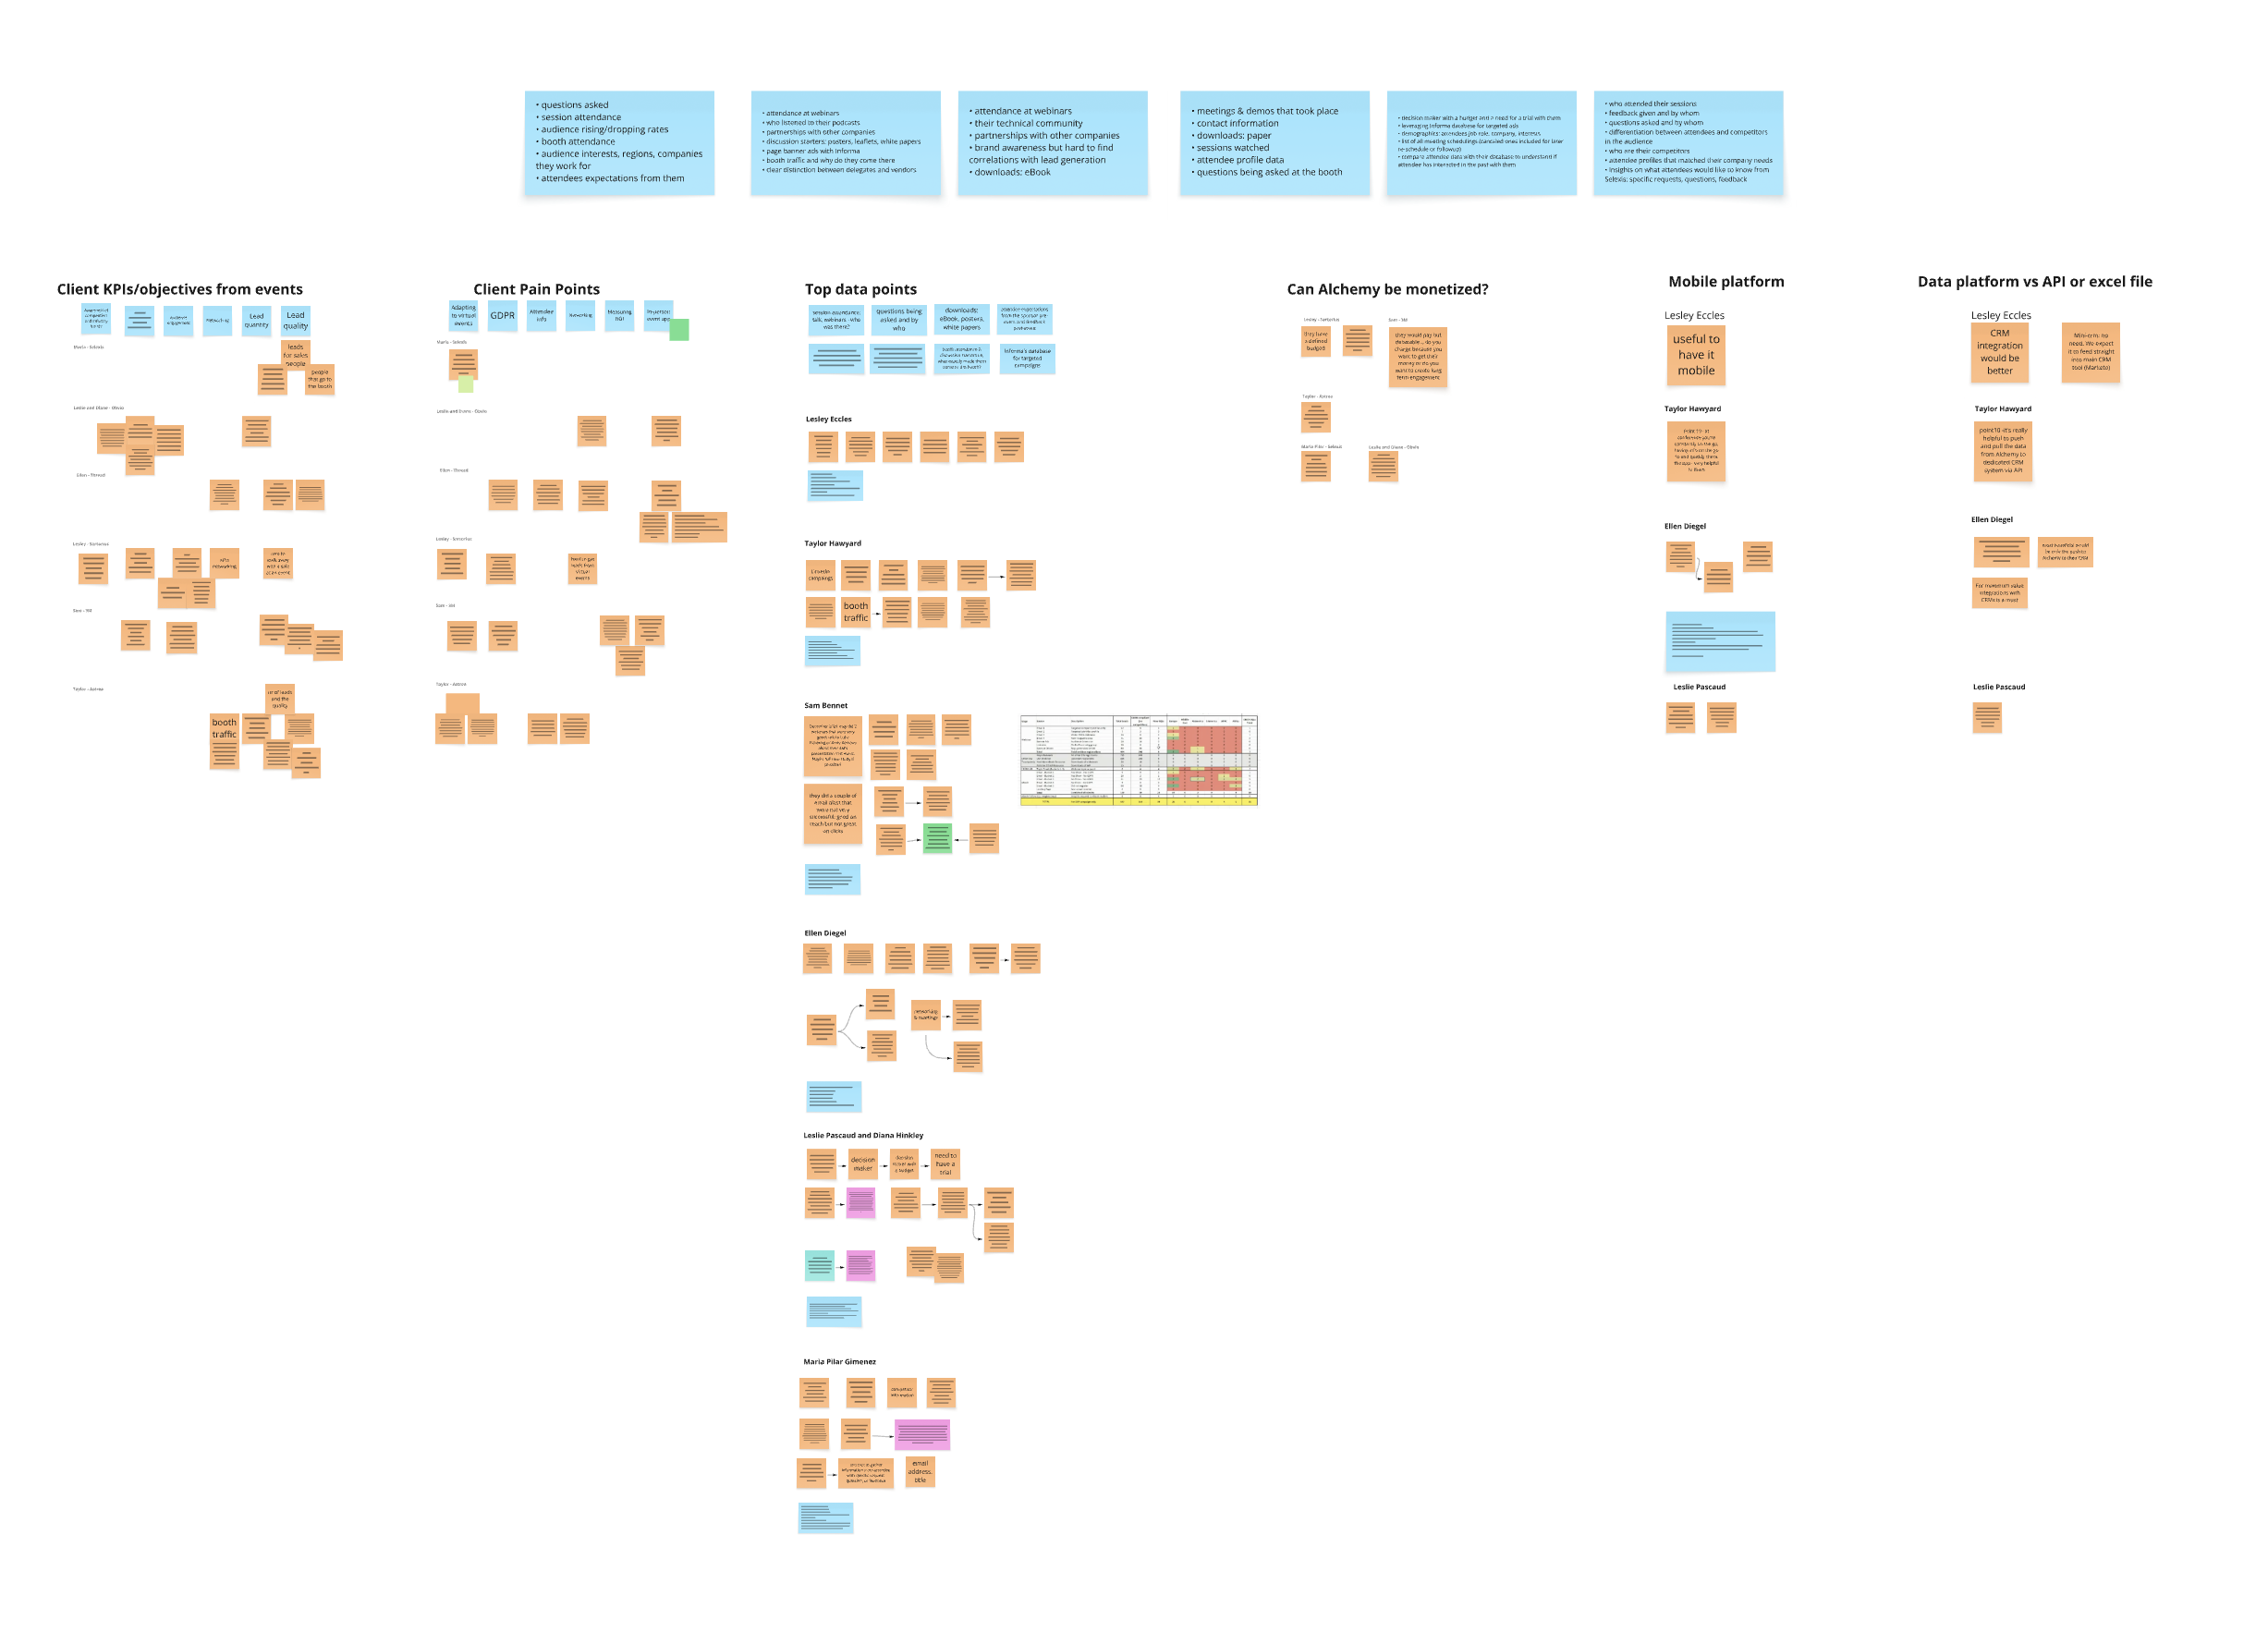
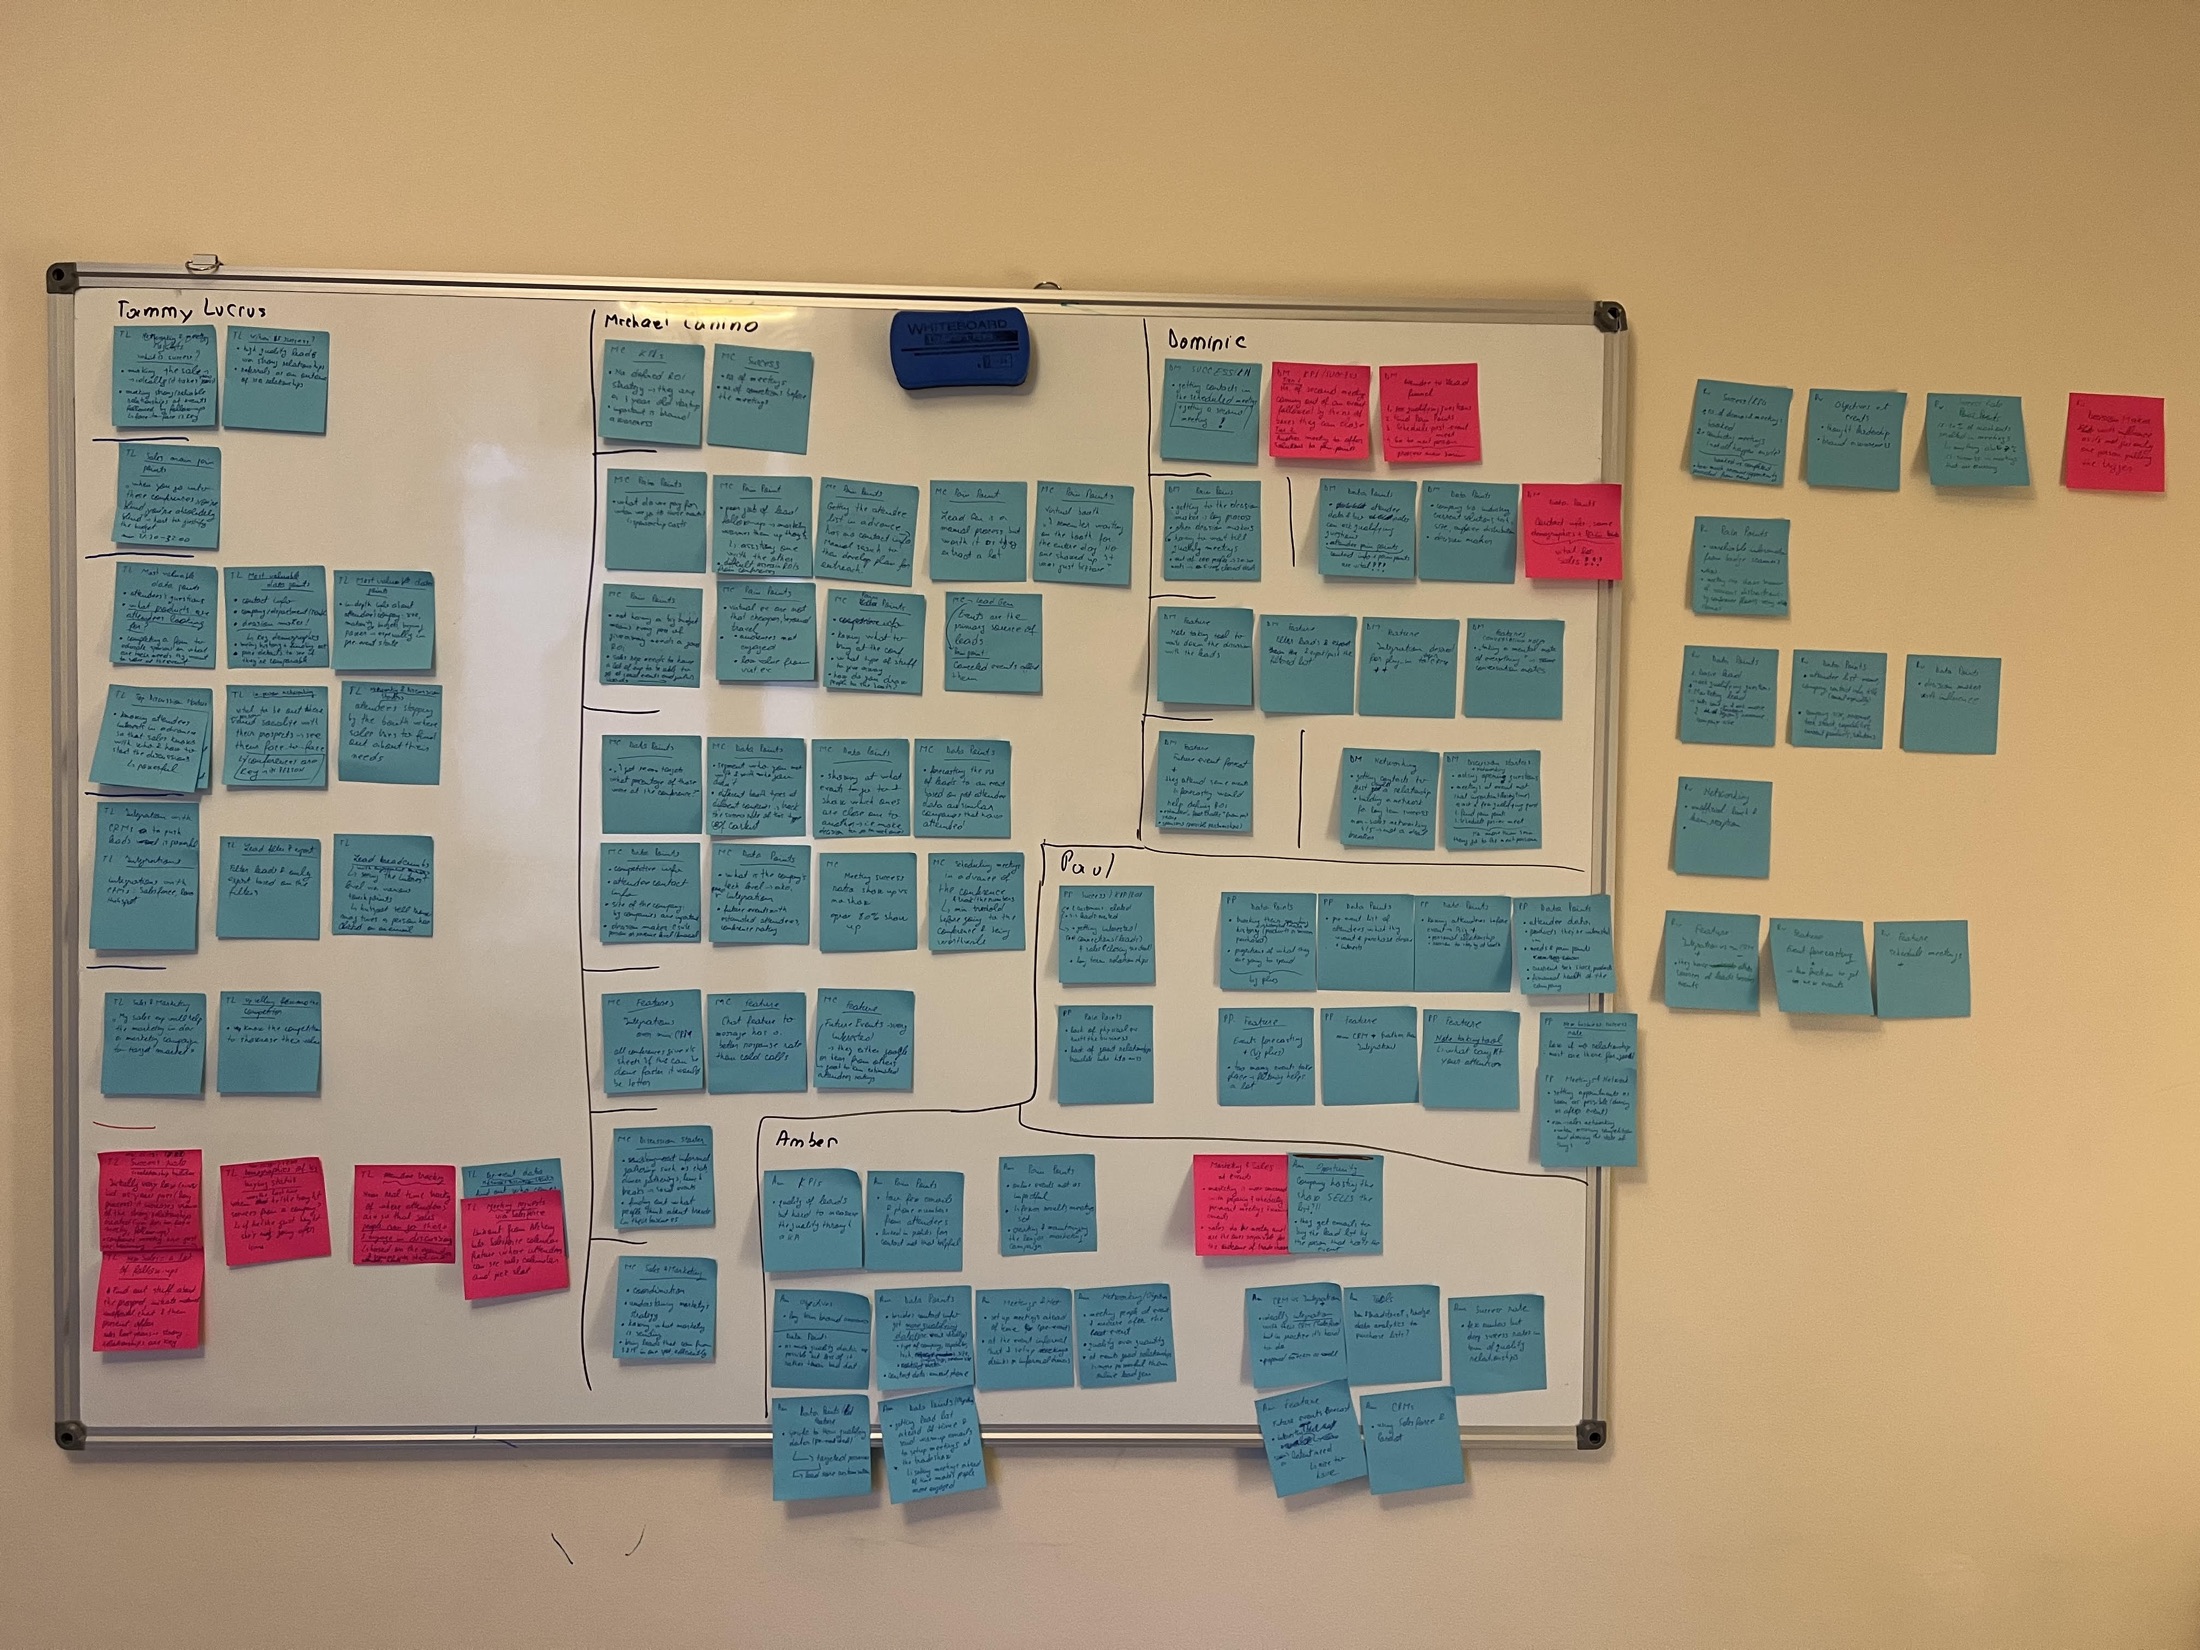
We ran two rounds of research. First, 9 stakeholder interviews across sales, marketing and customer care. Then 7 discovery interviews with existing customers: I ran two, supported five, and documented every session from the recordings before converging on findings with the researcher.
Gathering insights
The sessions kept returning to one expectation: customers already paid Informa to exhibit, so post-event data should come with the contract. Low lead quality made the return on sponsoring hard to measure. Exhibitors also struggled to get basic attendee data under GDPR, to measure brand engagement, and to balance lead quantity with quality. A premium tier would not sell.
Mapping the journey
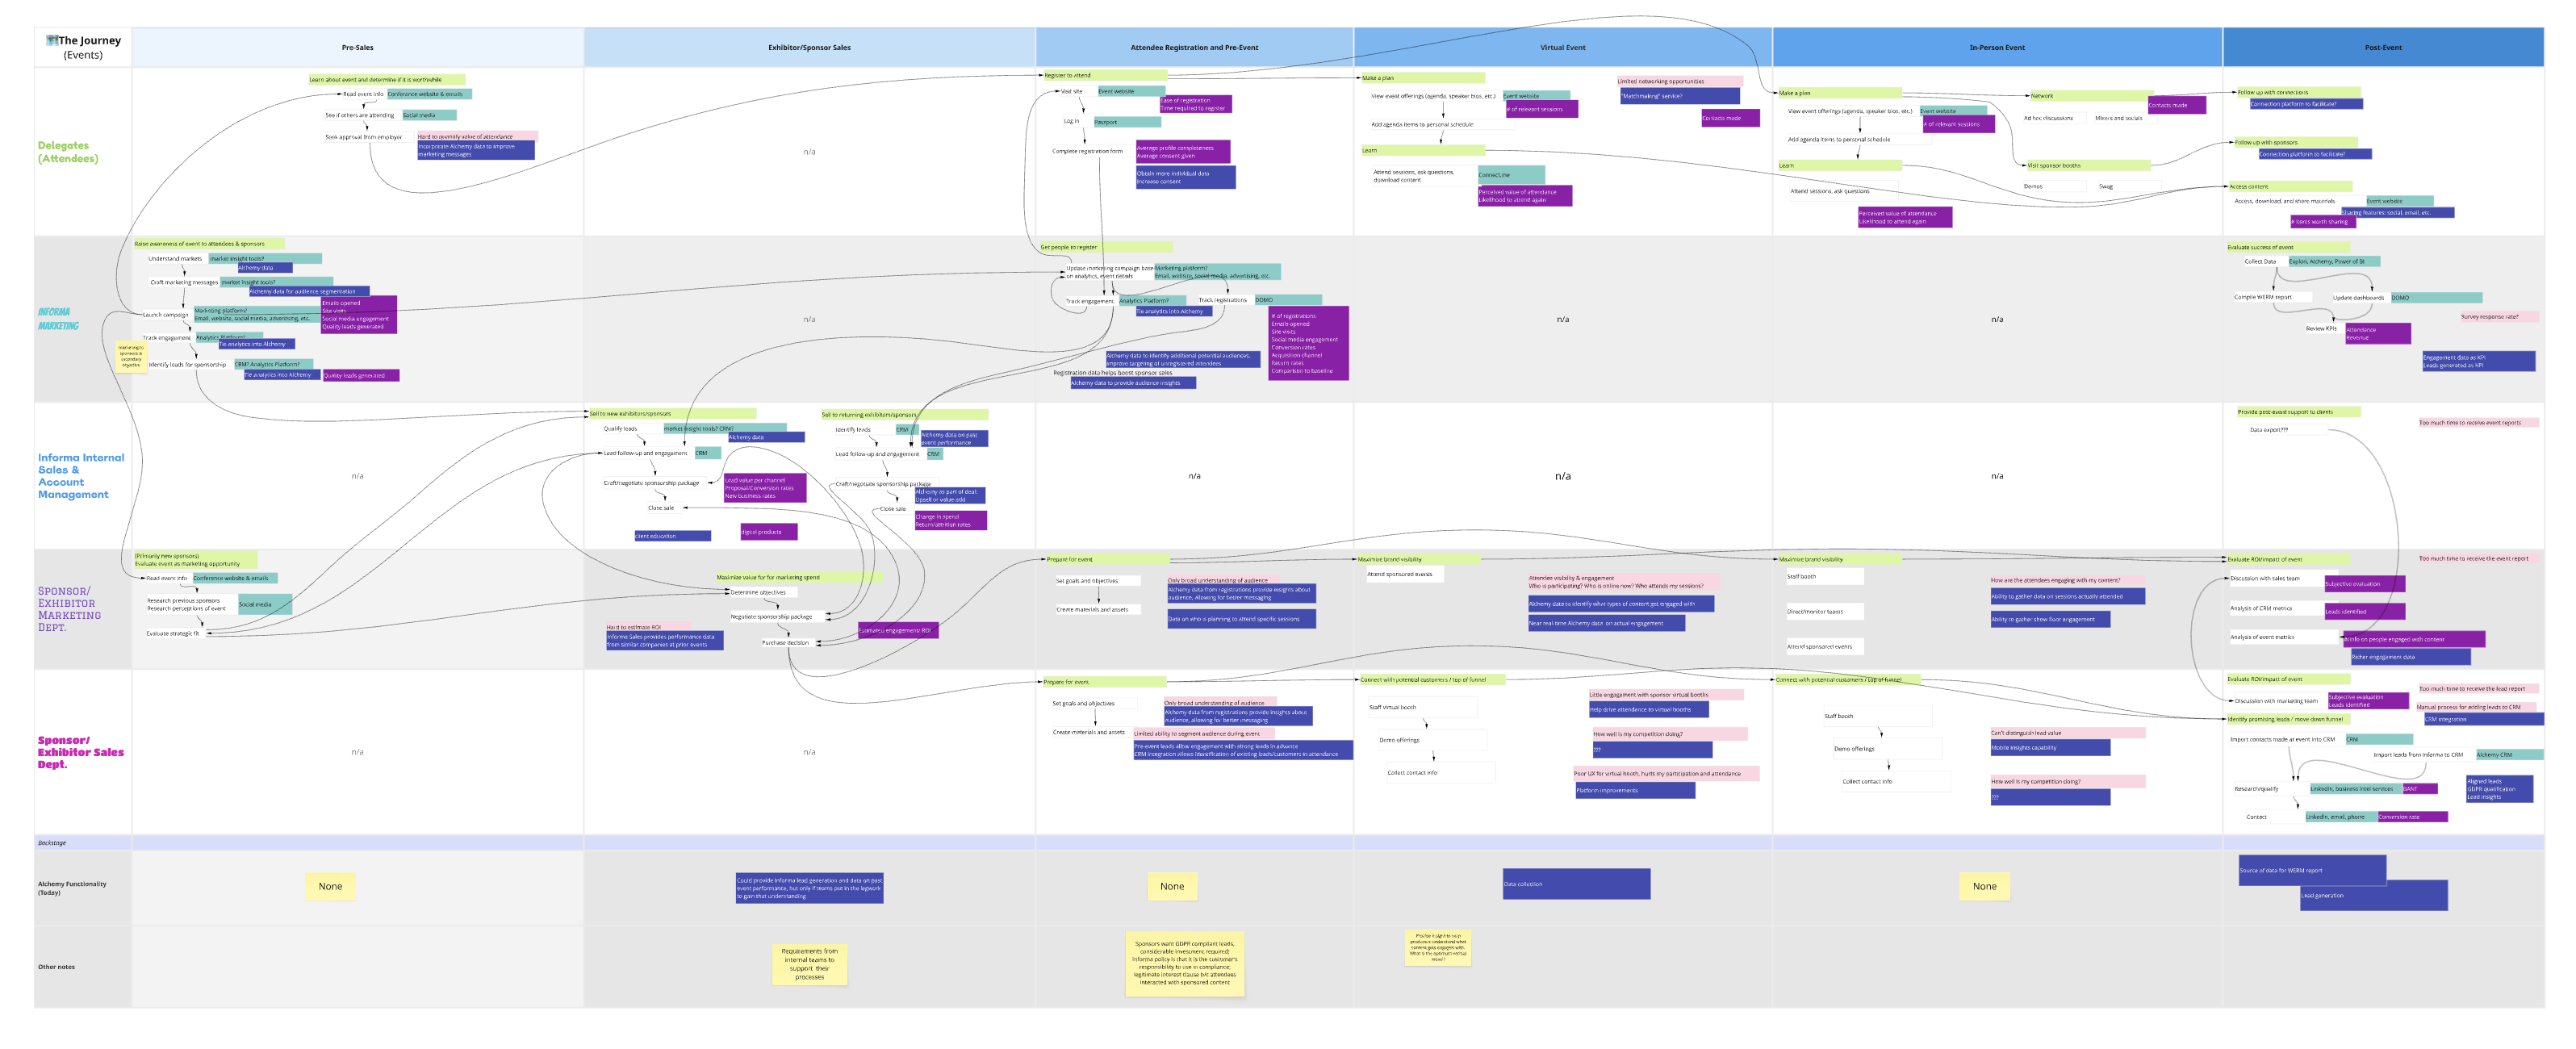
I helped the UX Researcher to map the three stages (pre-event, during the event and post-event) for five user segments: attendees, sponsor marketing, sponsor sales, Informa marketing and Informa sales. Attendees were the most valuable segment, so everything after this point was designed mainly for the sponsor side.
It was never a dashboard
In testing, people leaned forward at the lead profile, one person’s full history with the company and the buying signals inside it. It became the centre of the product. The dashboard became the way in.
Ideation and prototyping
To kick off the solutioning phase, I ran an ideation session with the PM, researcher and business analyst to surface out as many ideas as possible and merged the output into a clickable prototype after two months of research.
User testing
A second researcher handover and slow client scheduling had cost us weeks, so we moved recruitment to userinterviews.com and booked 7 sessions across 2 days and some extra 3 sessions with Informa customers. Findings were scored by how often each issue came up, giving the client a ranked list to act on.
Gathering insights
People wanted a powerful lead analysis tool: a person’s historical interaction with the company and their top buying signals, with filters by activity, job title, company and engagement to find strong leads. Some wanted to start paying for it as soon as possible.
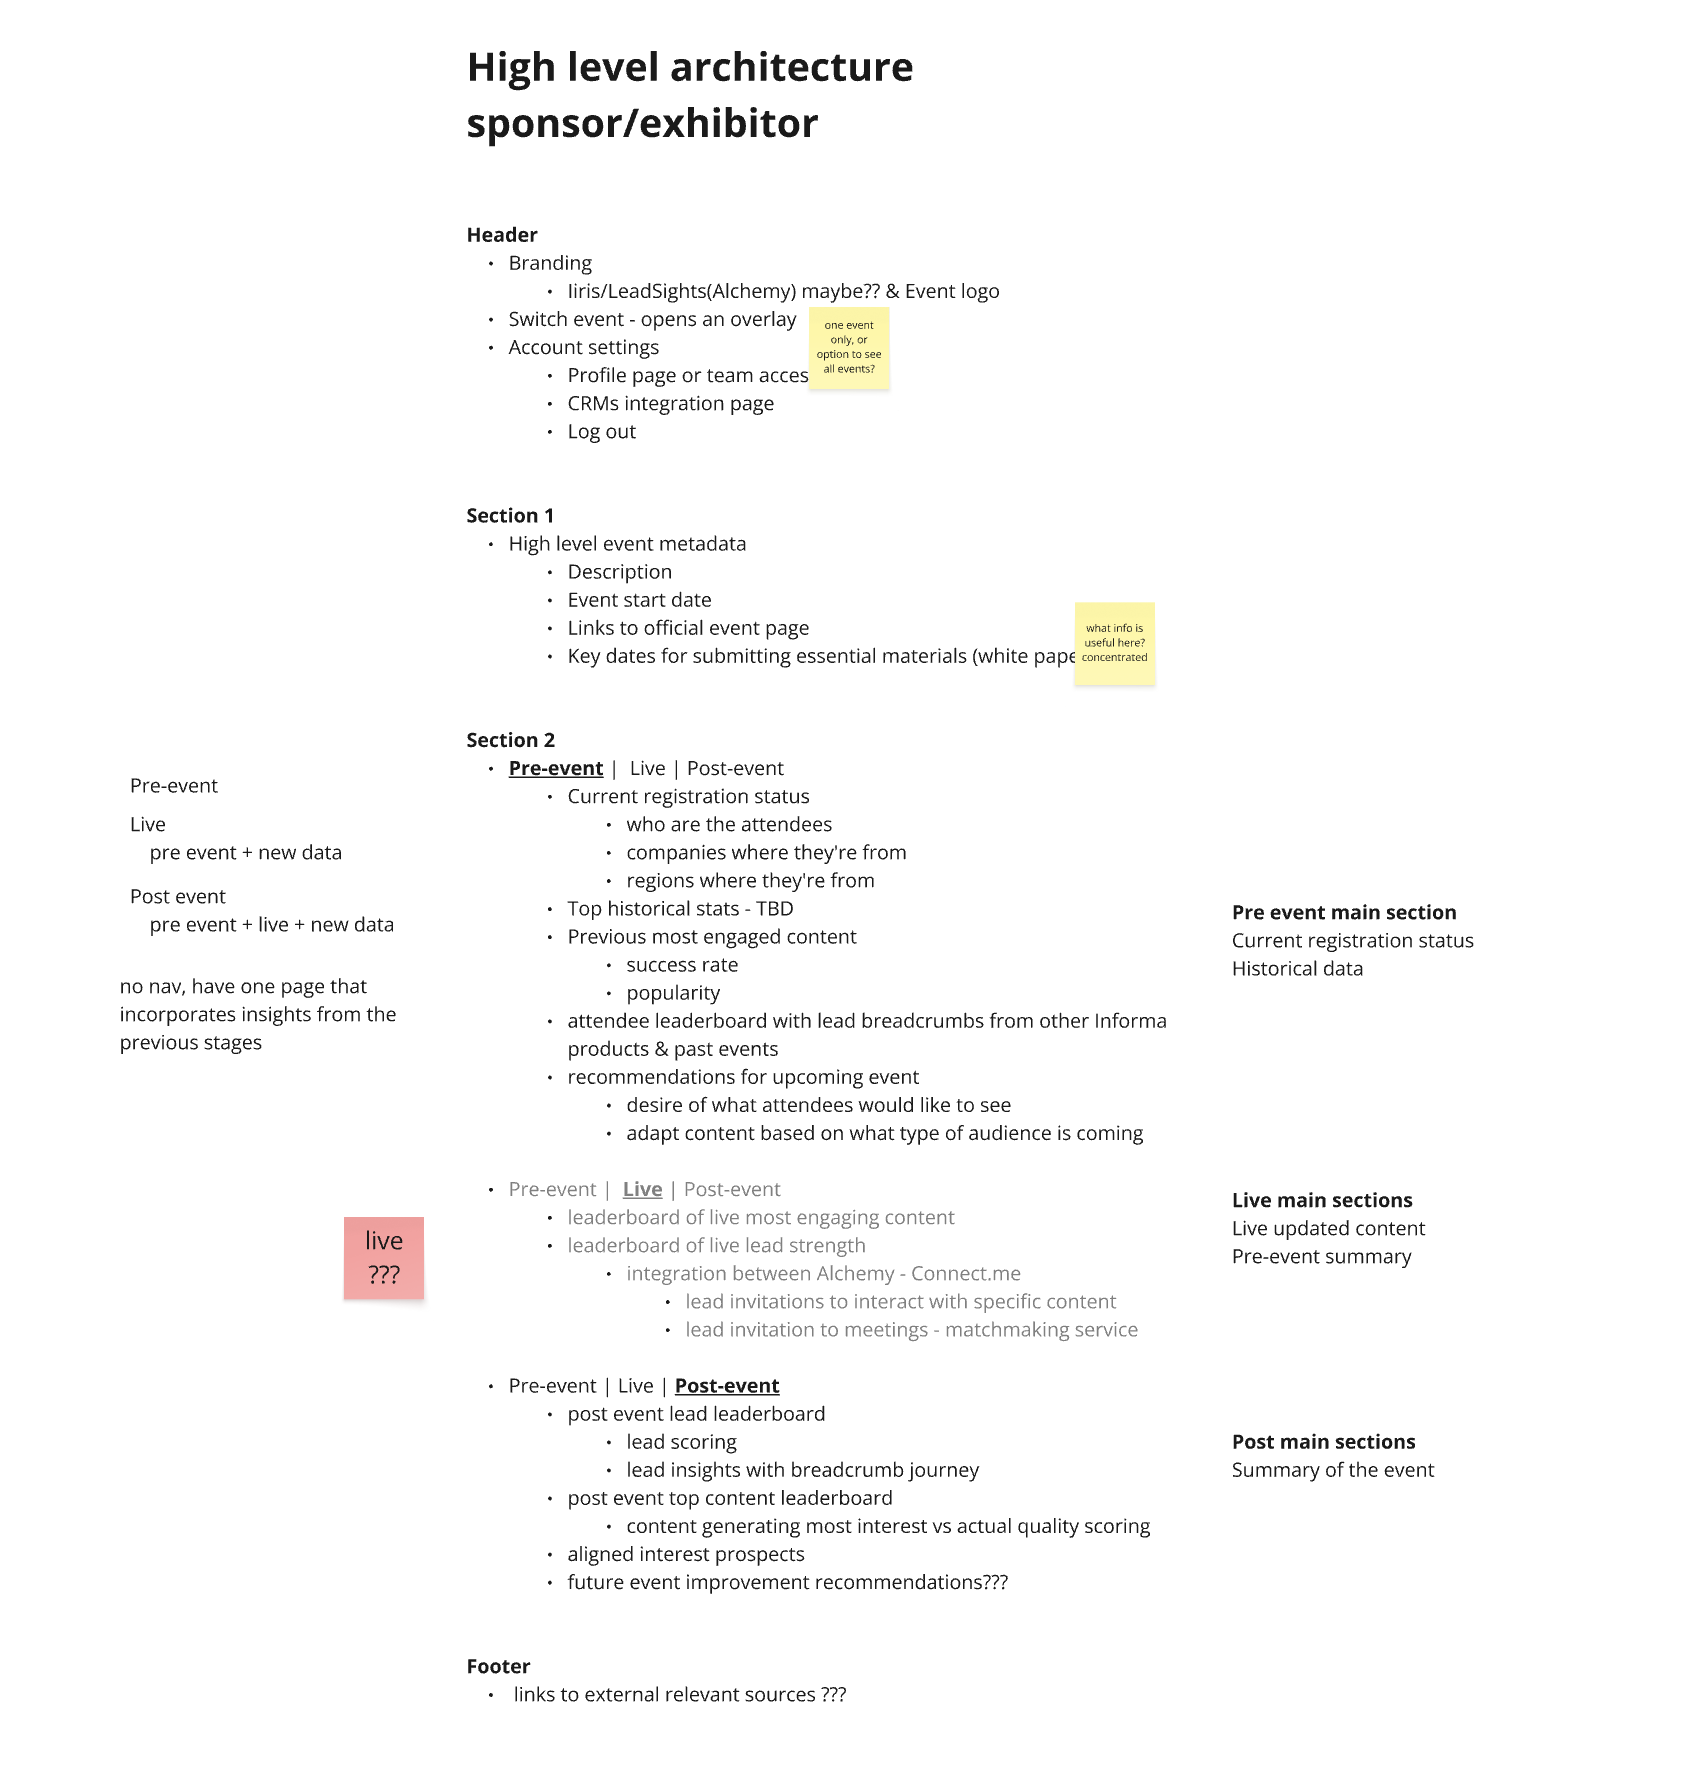
High level architecture of our insights from the discovery phase
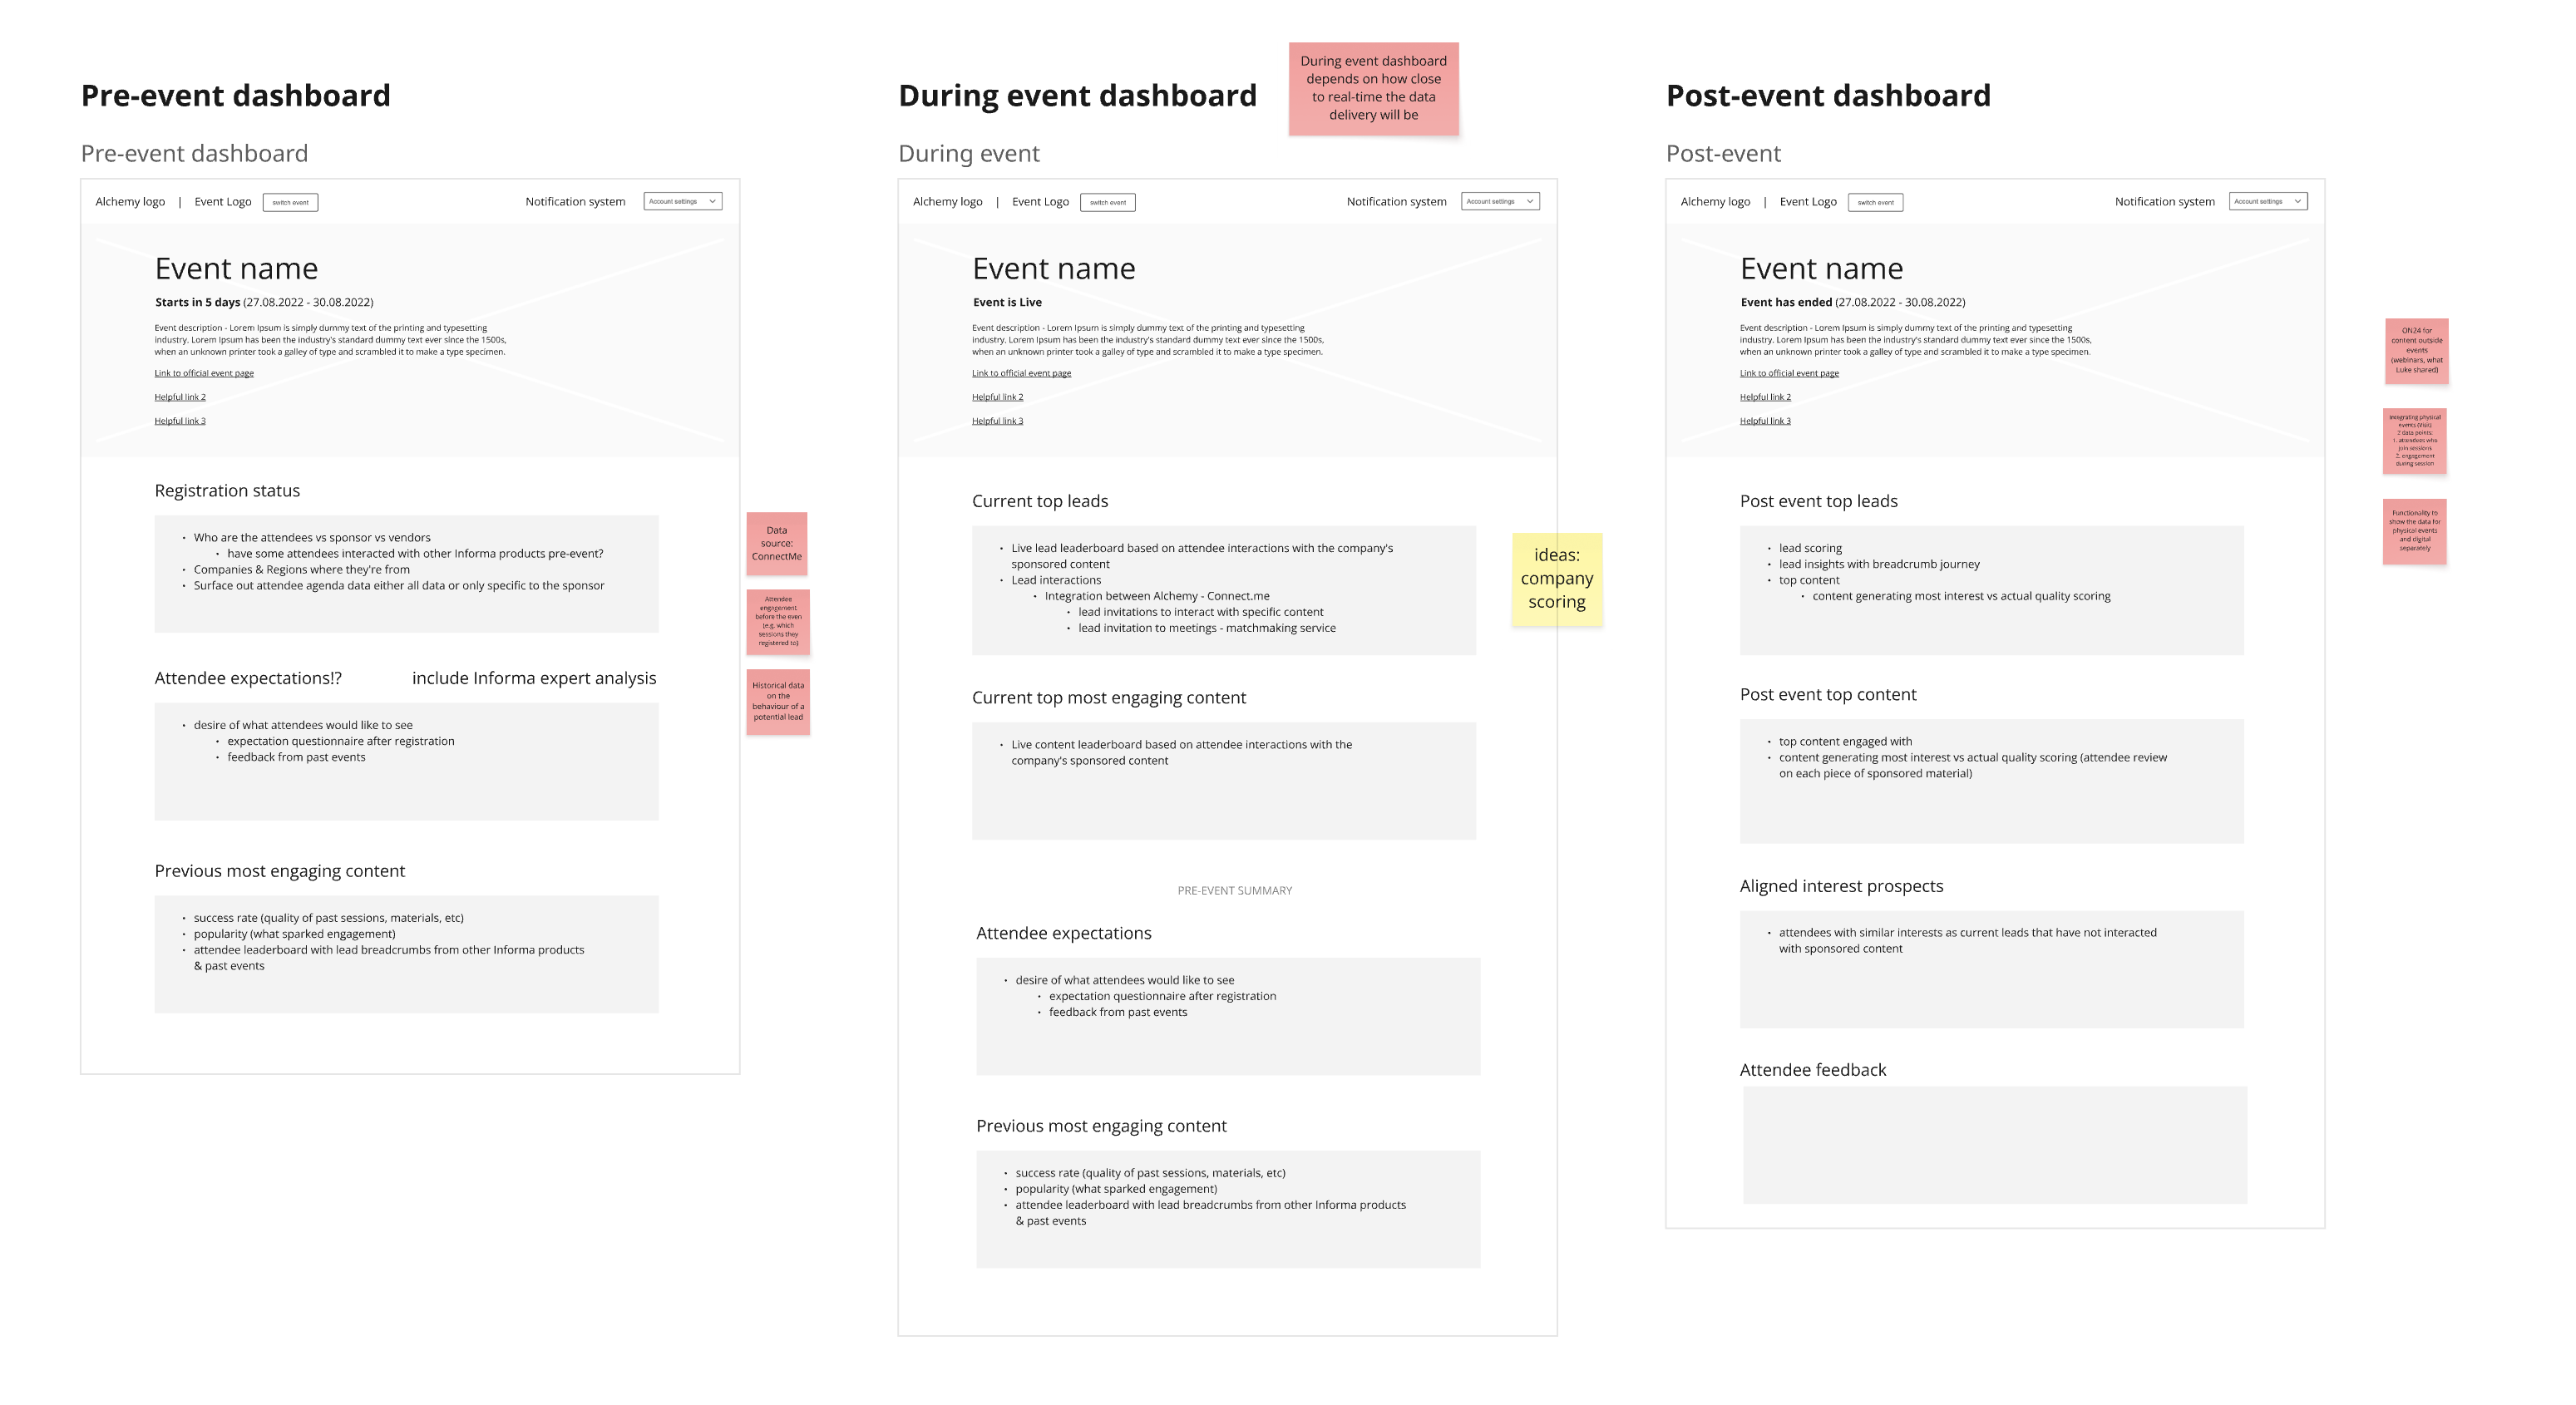
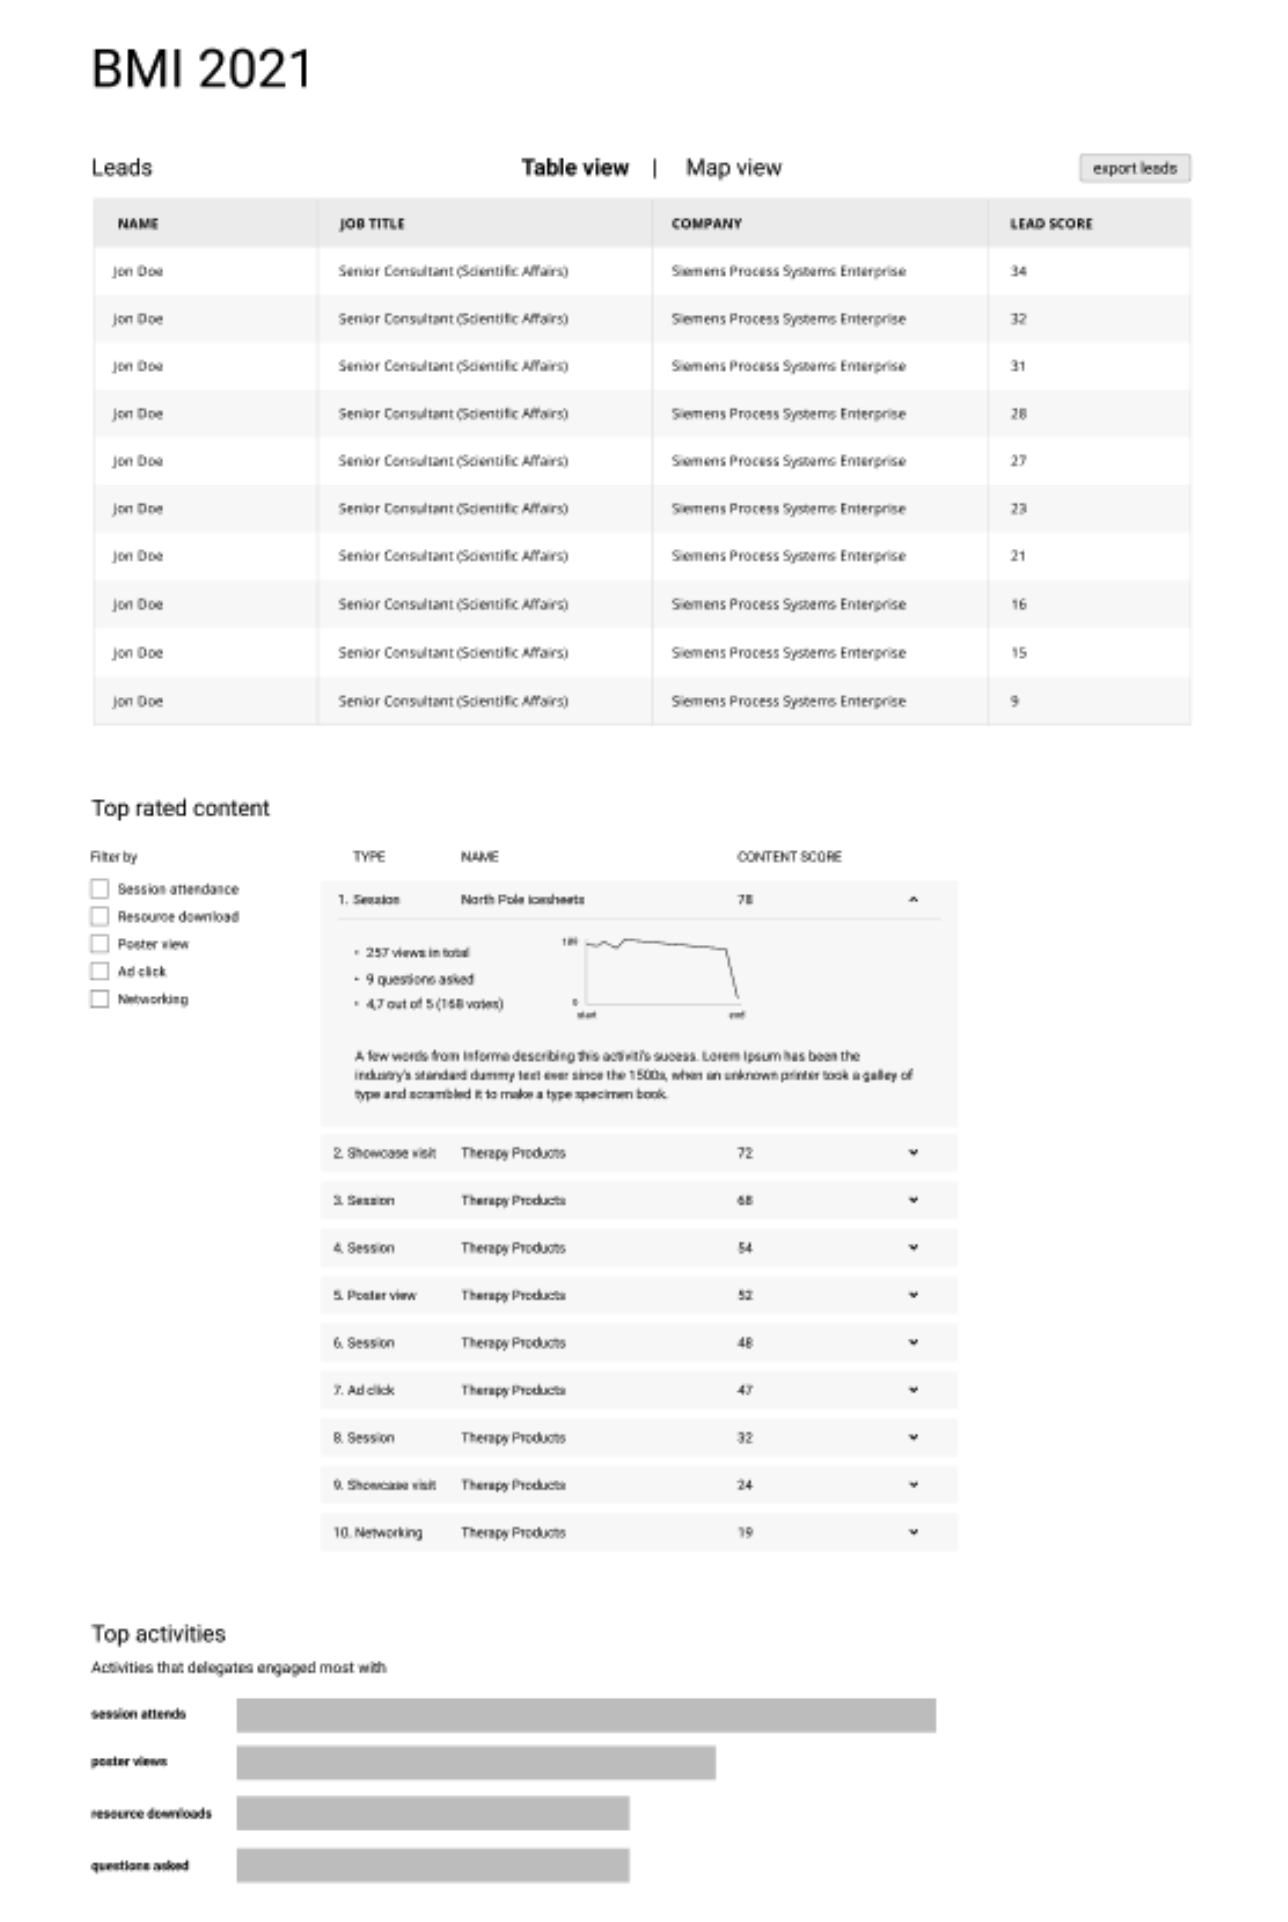
My first go on structuring the information into Pre / During / Post Event Dashboard
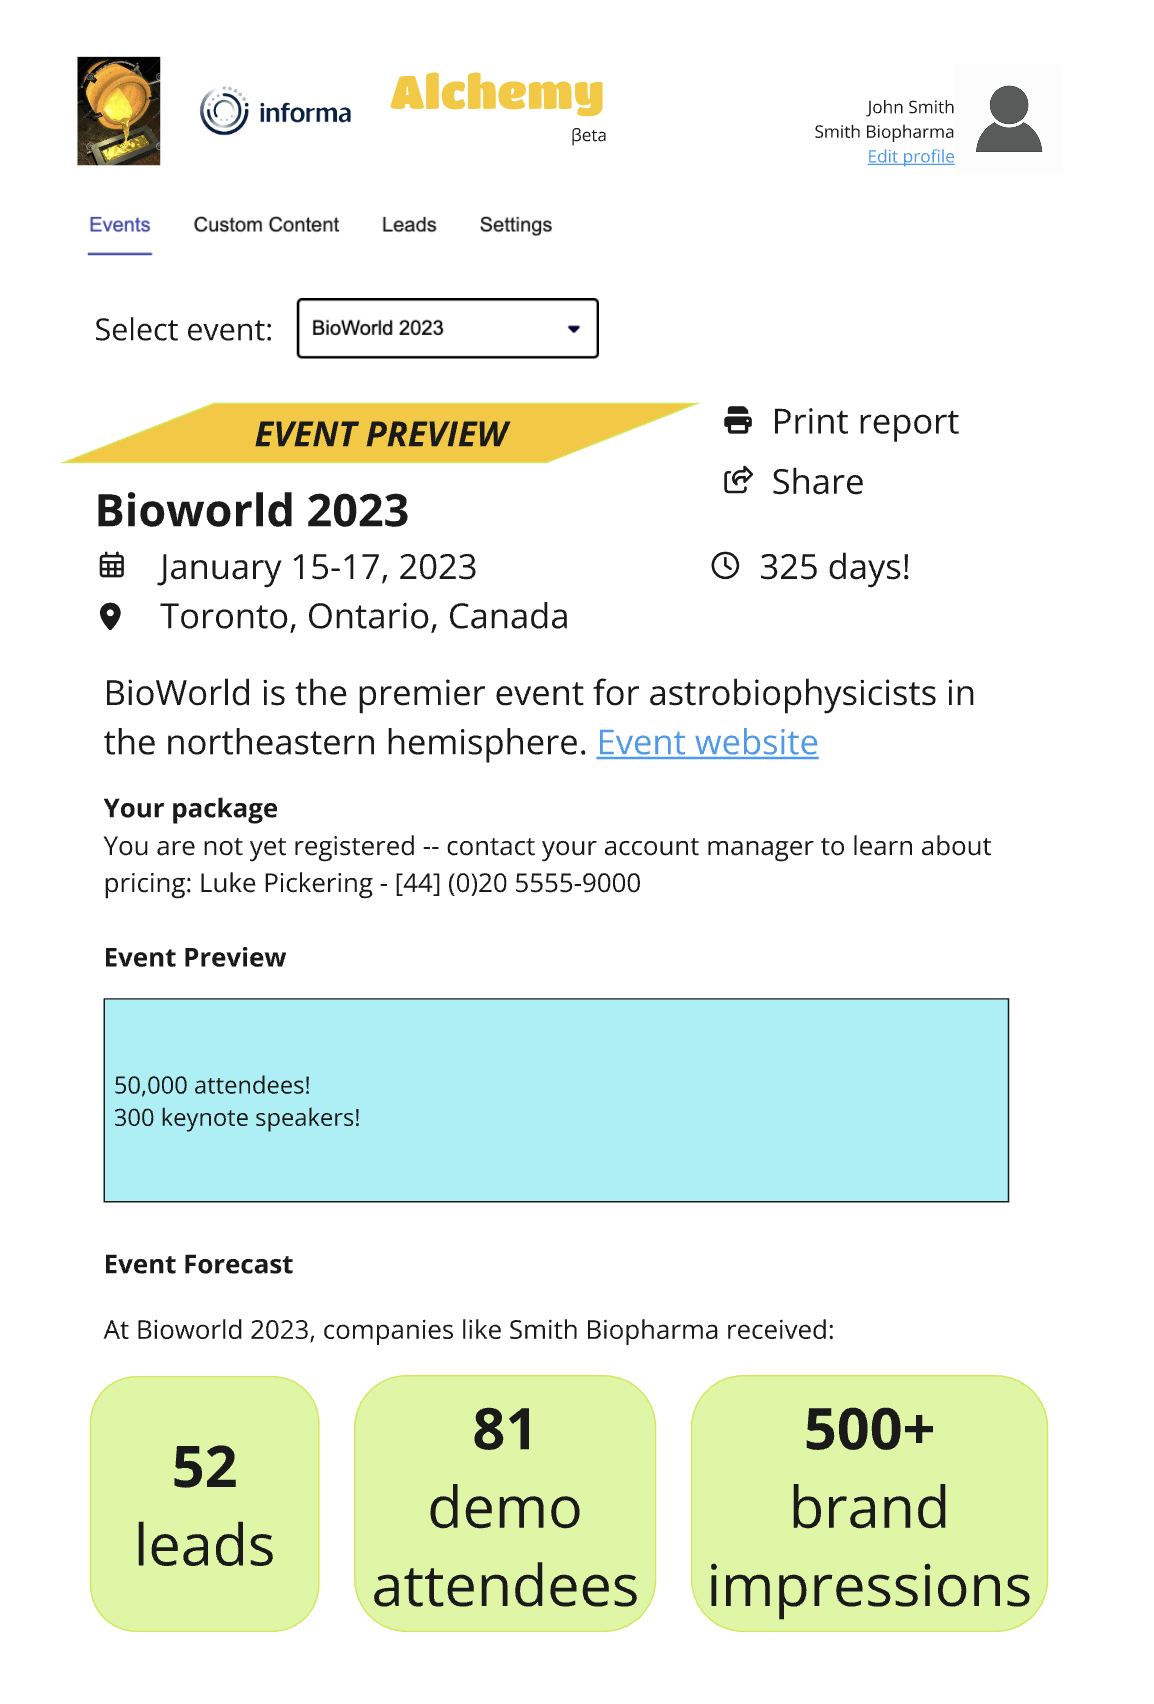
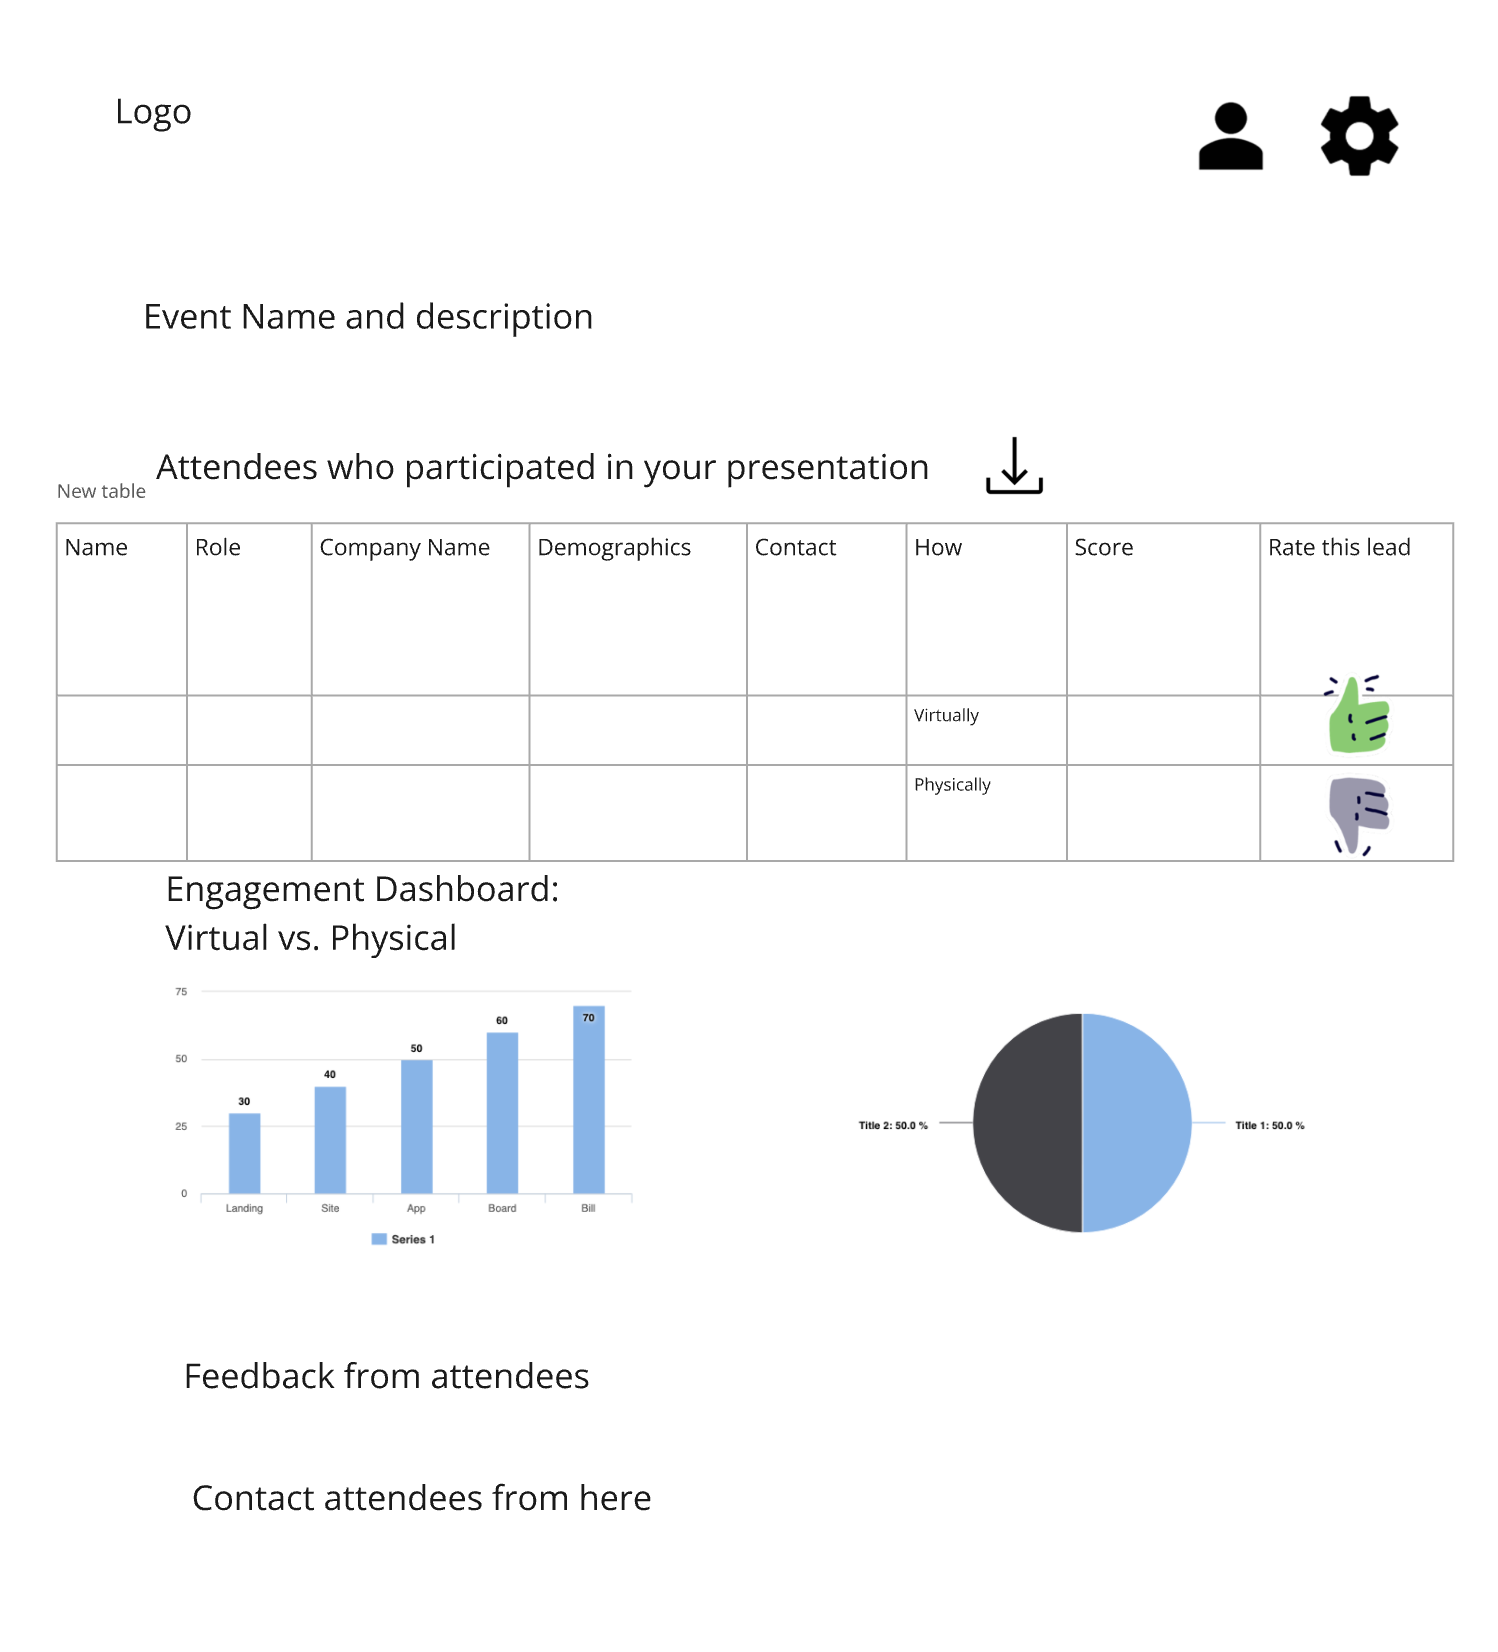
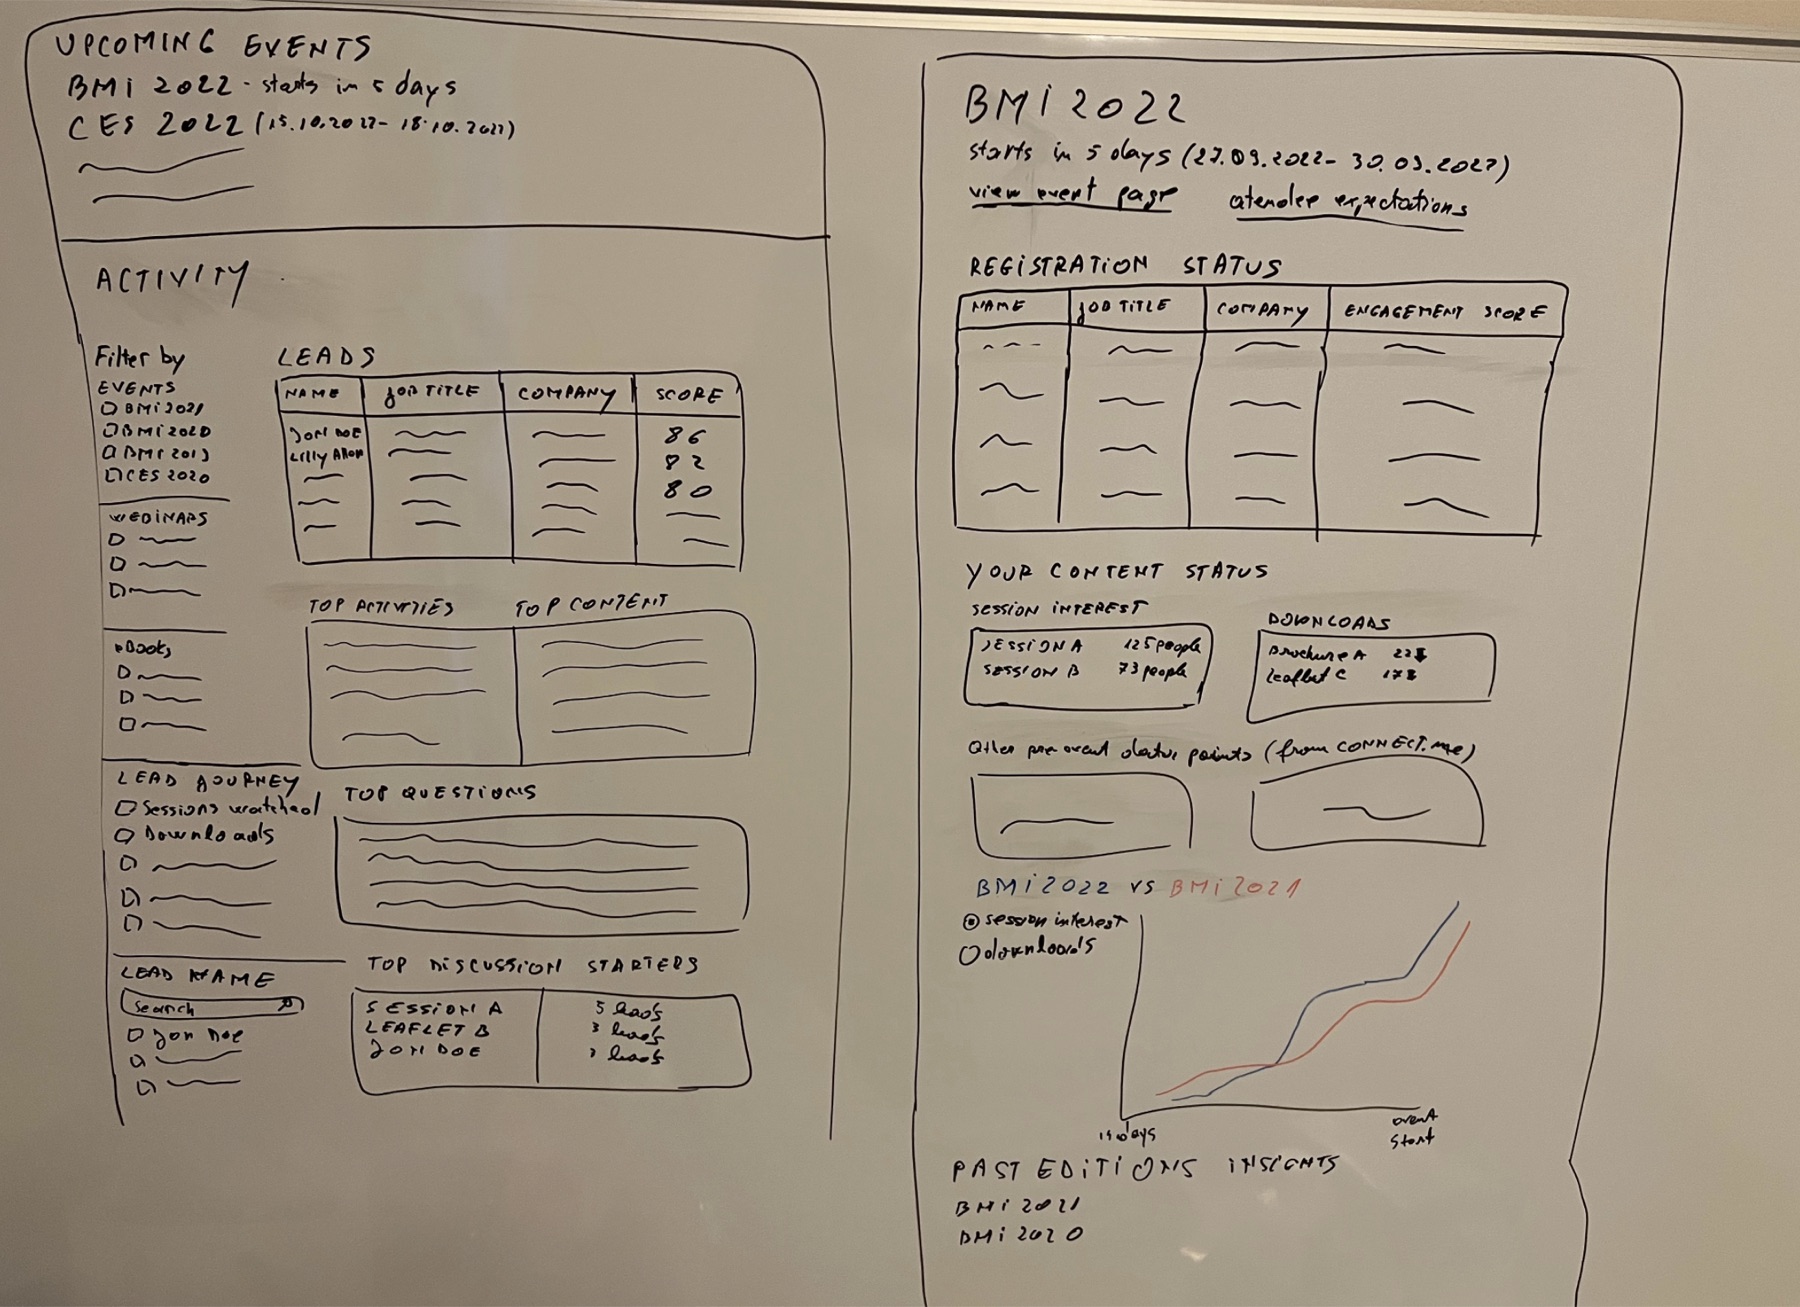
Preview of some ideas for the product during the ideation session with my team
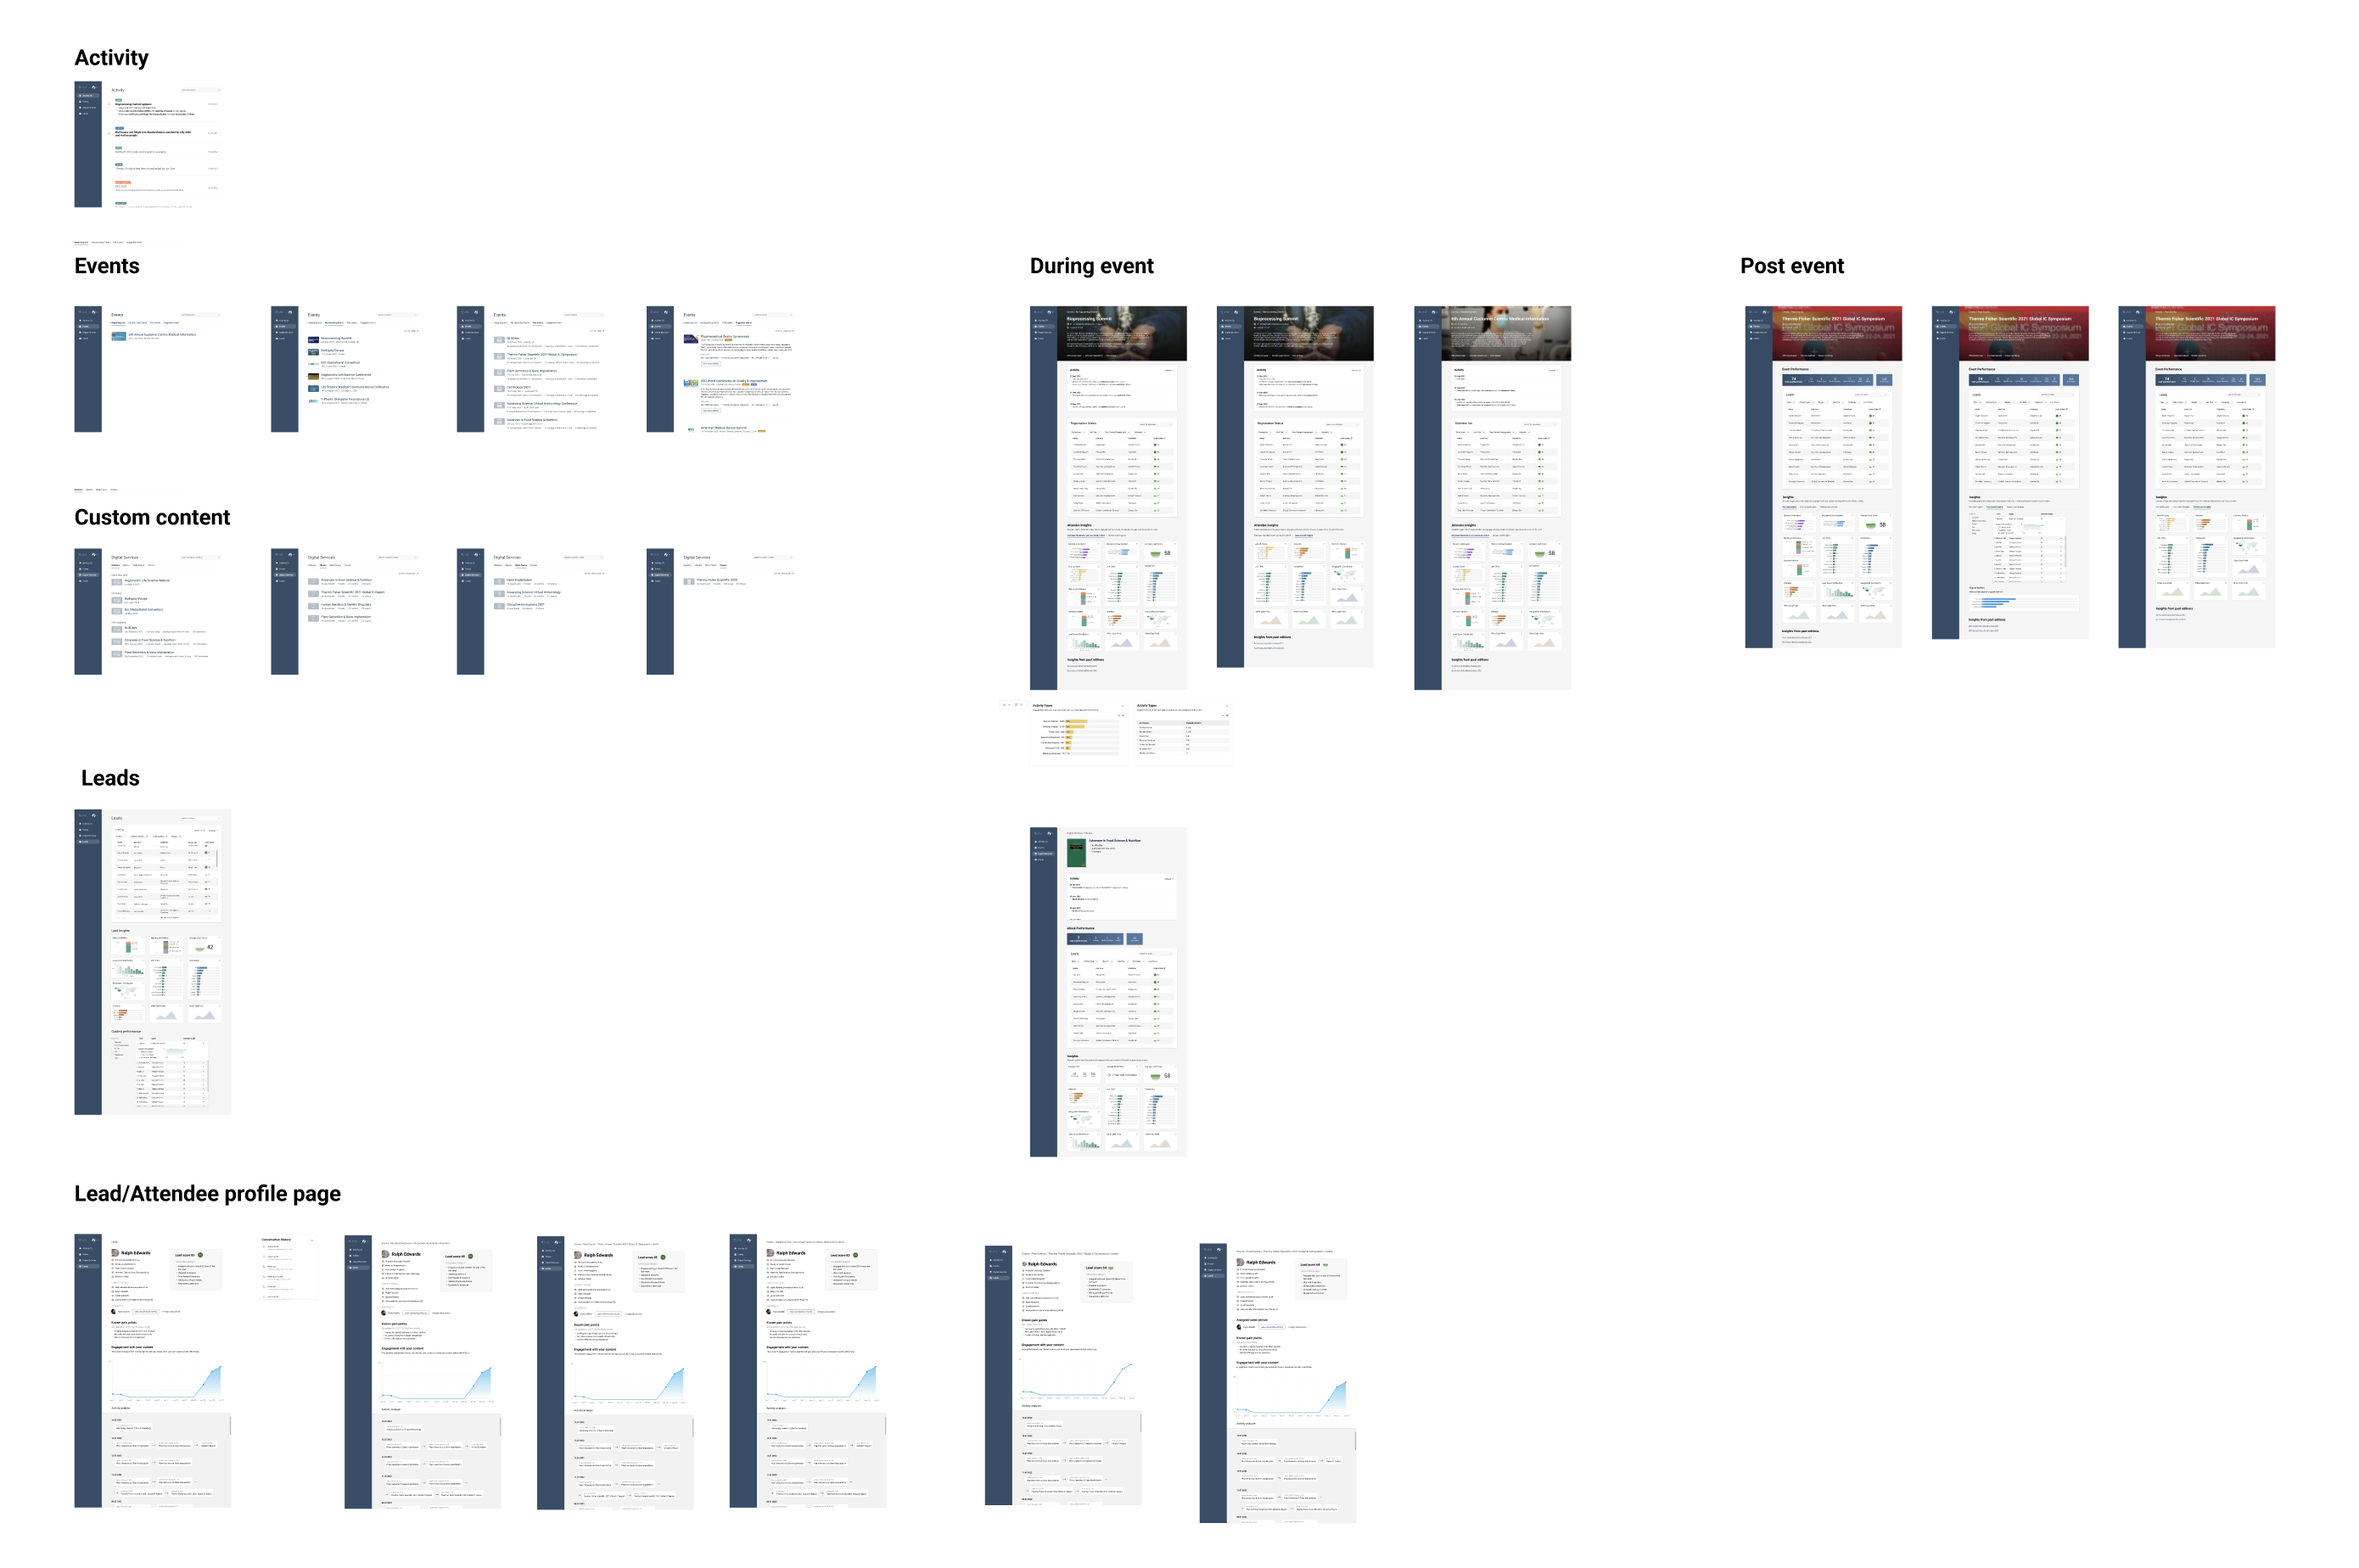
Wireframes of the consolidated solution
Screens from the prototype that we prepared for the evaluative phase
1/5
Prototype objectives
Test the clarity and assess the desirability of the concept
Test the global and local navigation
Further understand how Informa’s customers are evaluating the ROI when exhibiting at Informa events and how can we better meet their needs with this platform
My work on the final product
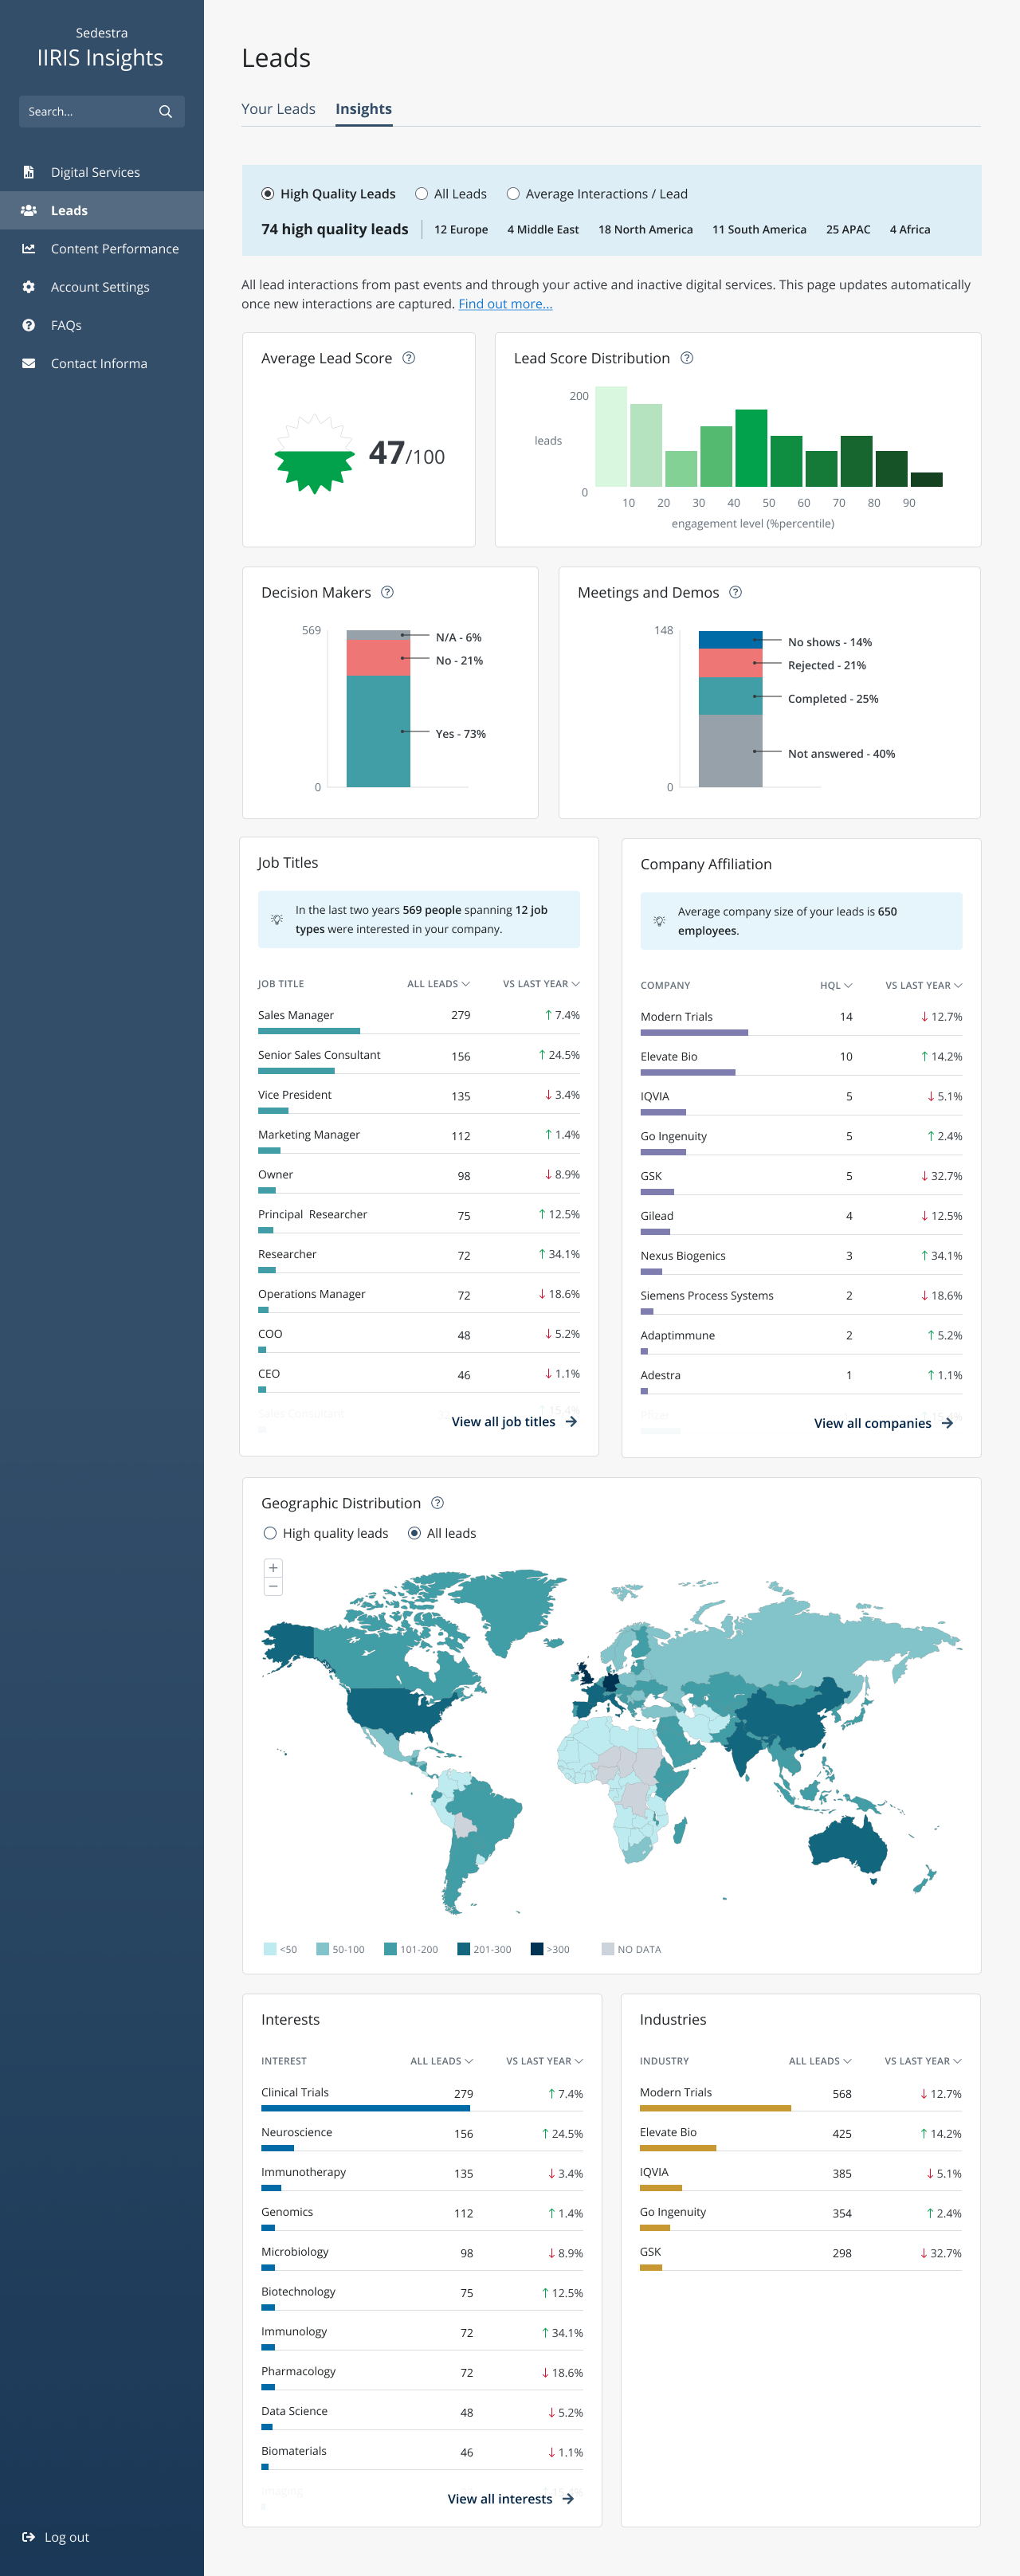
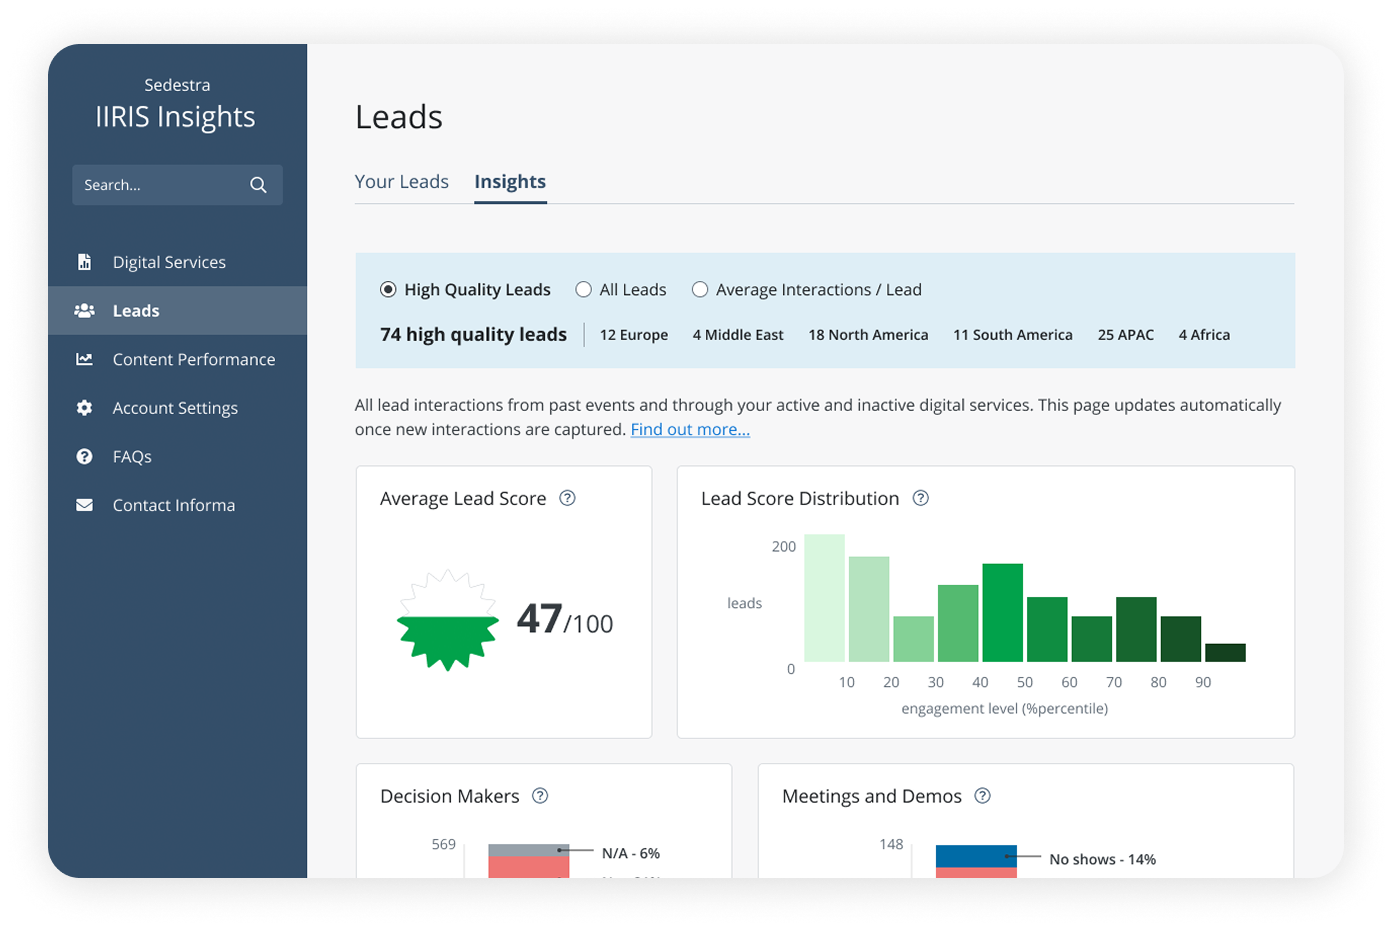
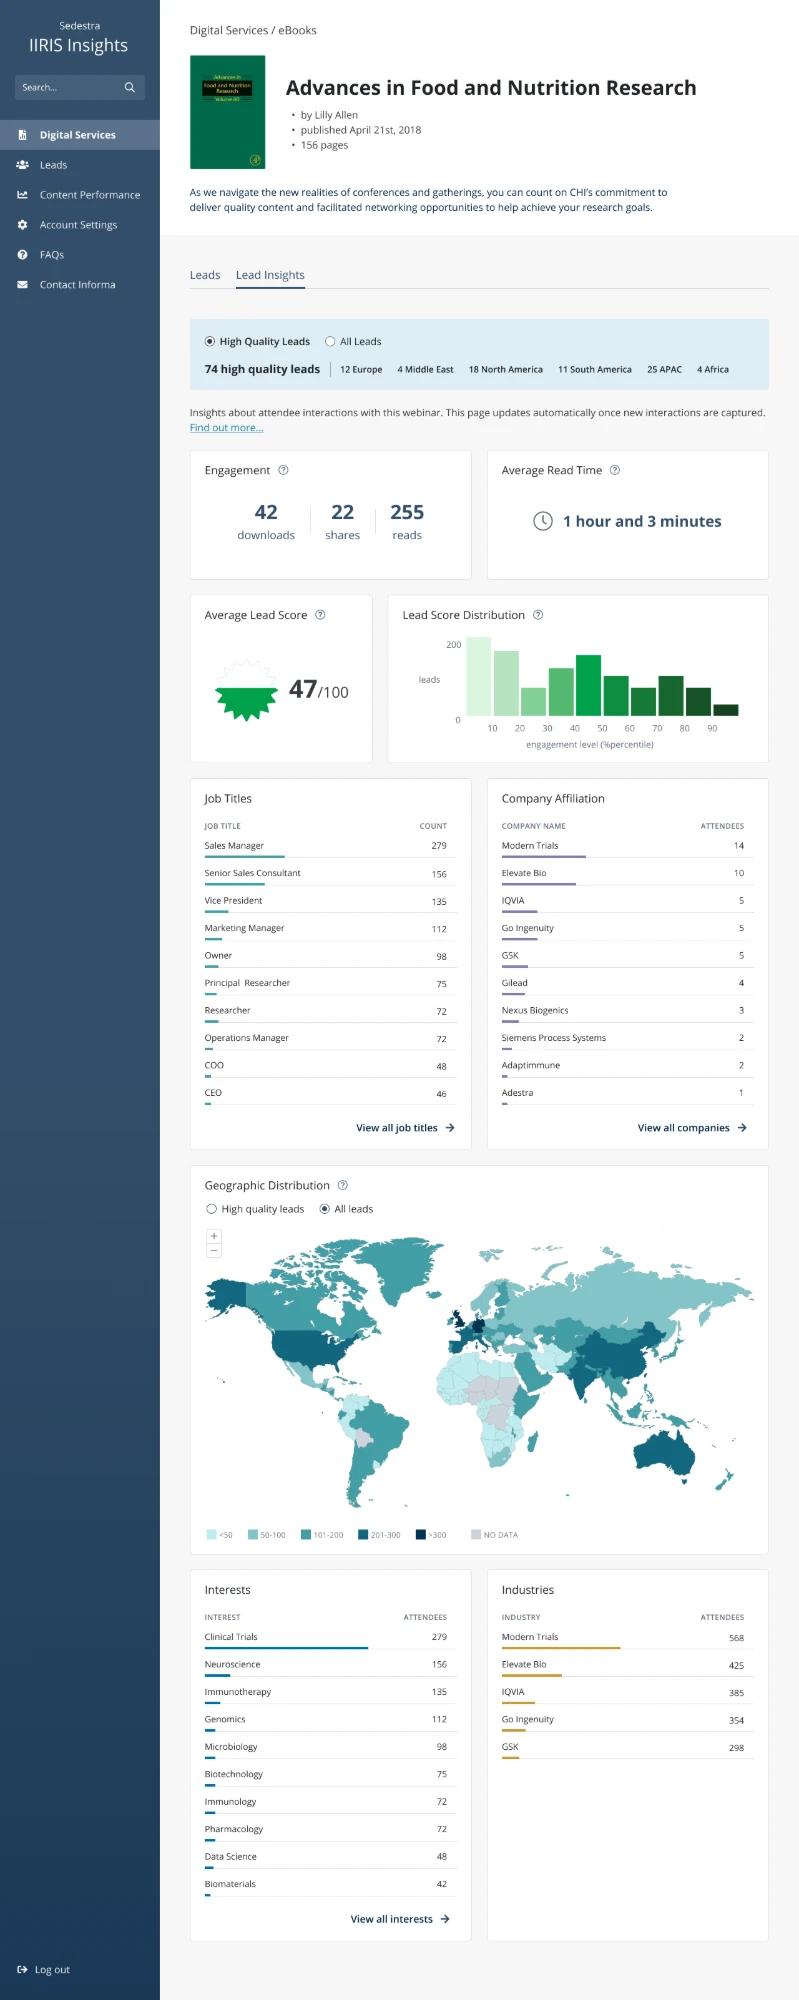
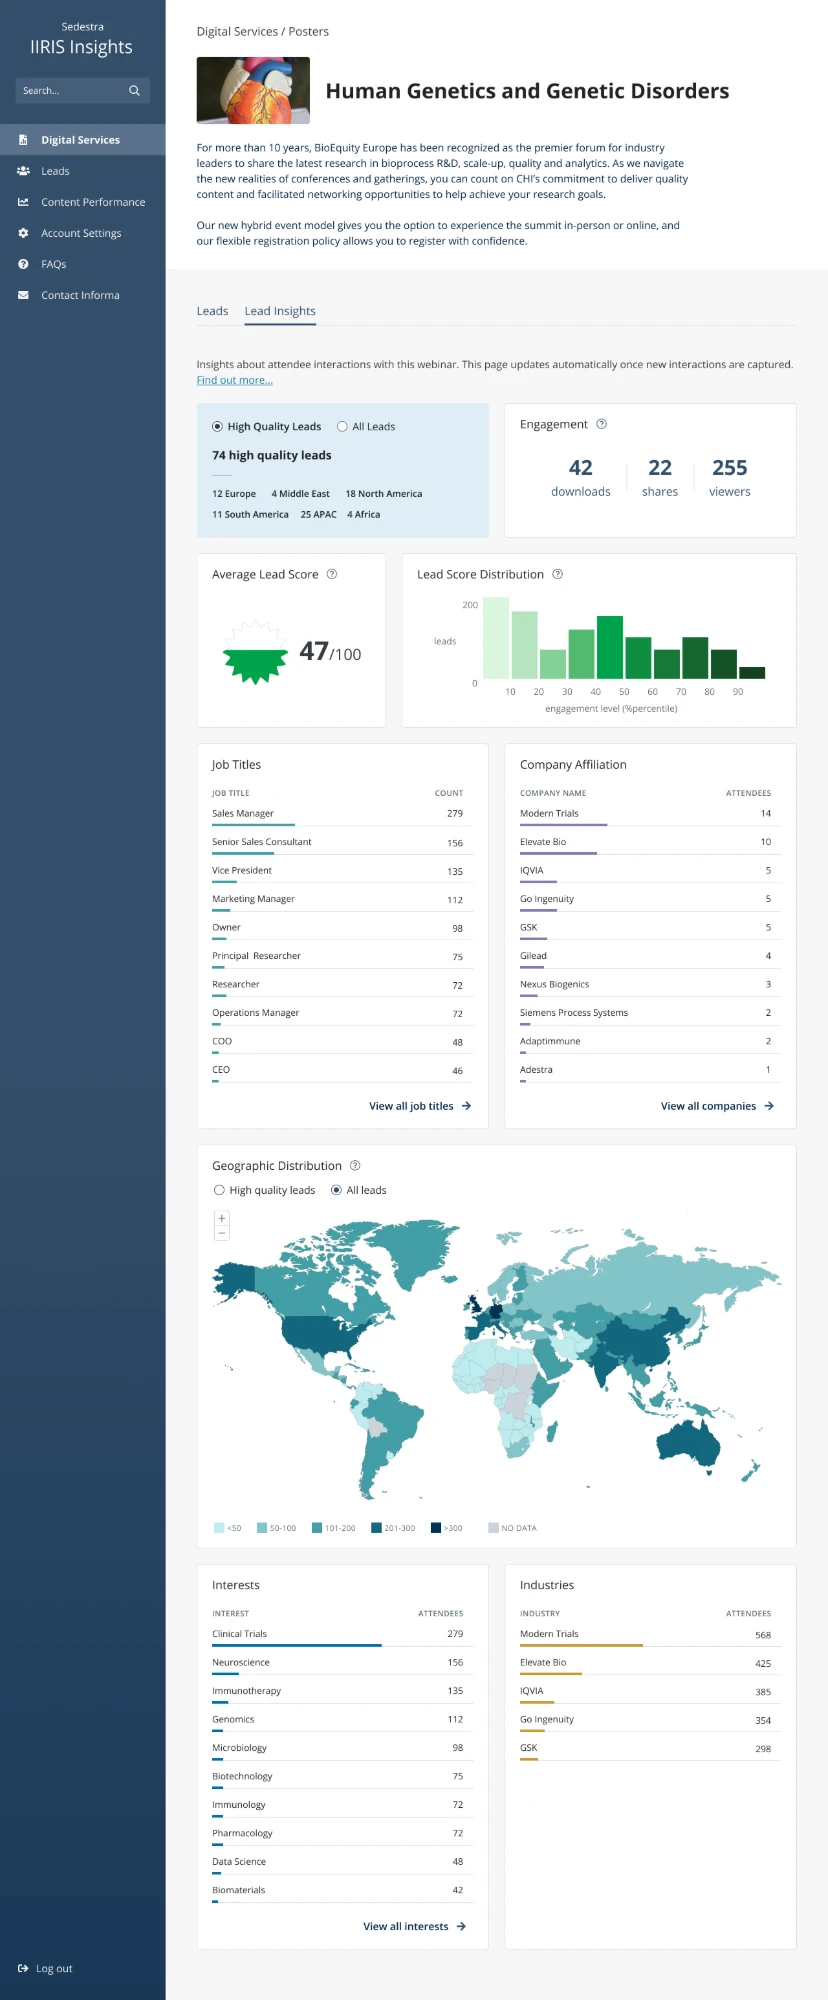
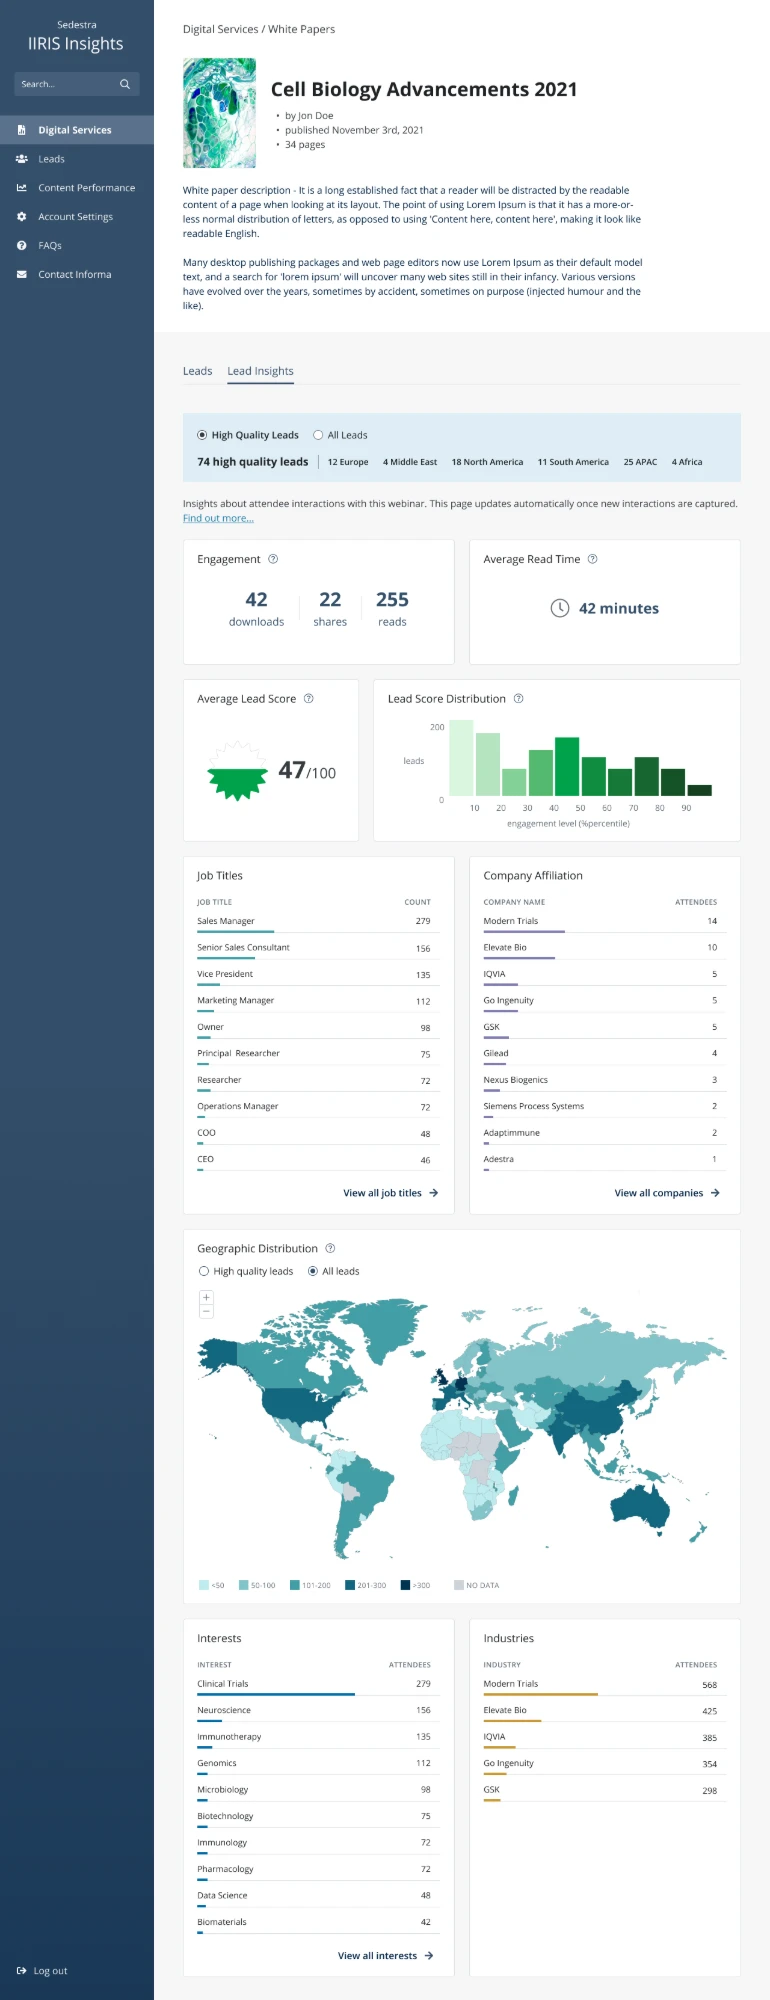
Lead Insights
How engaged an event’s leads are. Research showed:
Engagement beats volume.
Meetings and demos show intent.
Job titles and companies reveal who’s behind the numbers.
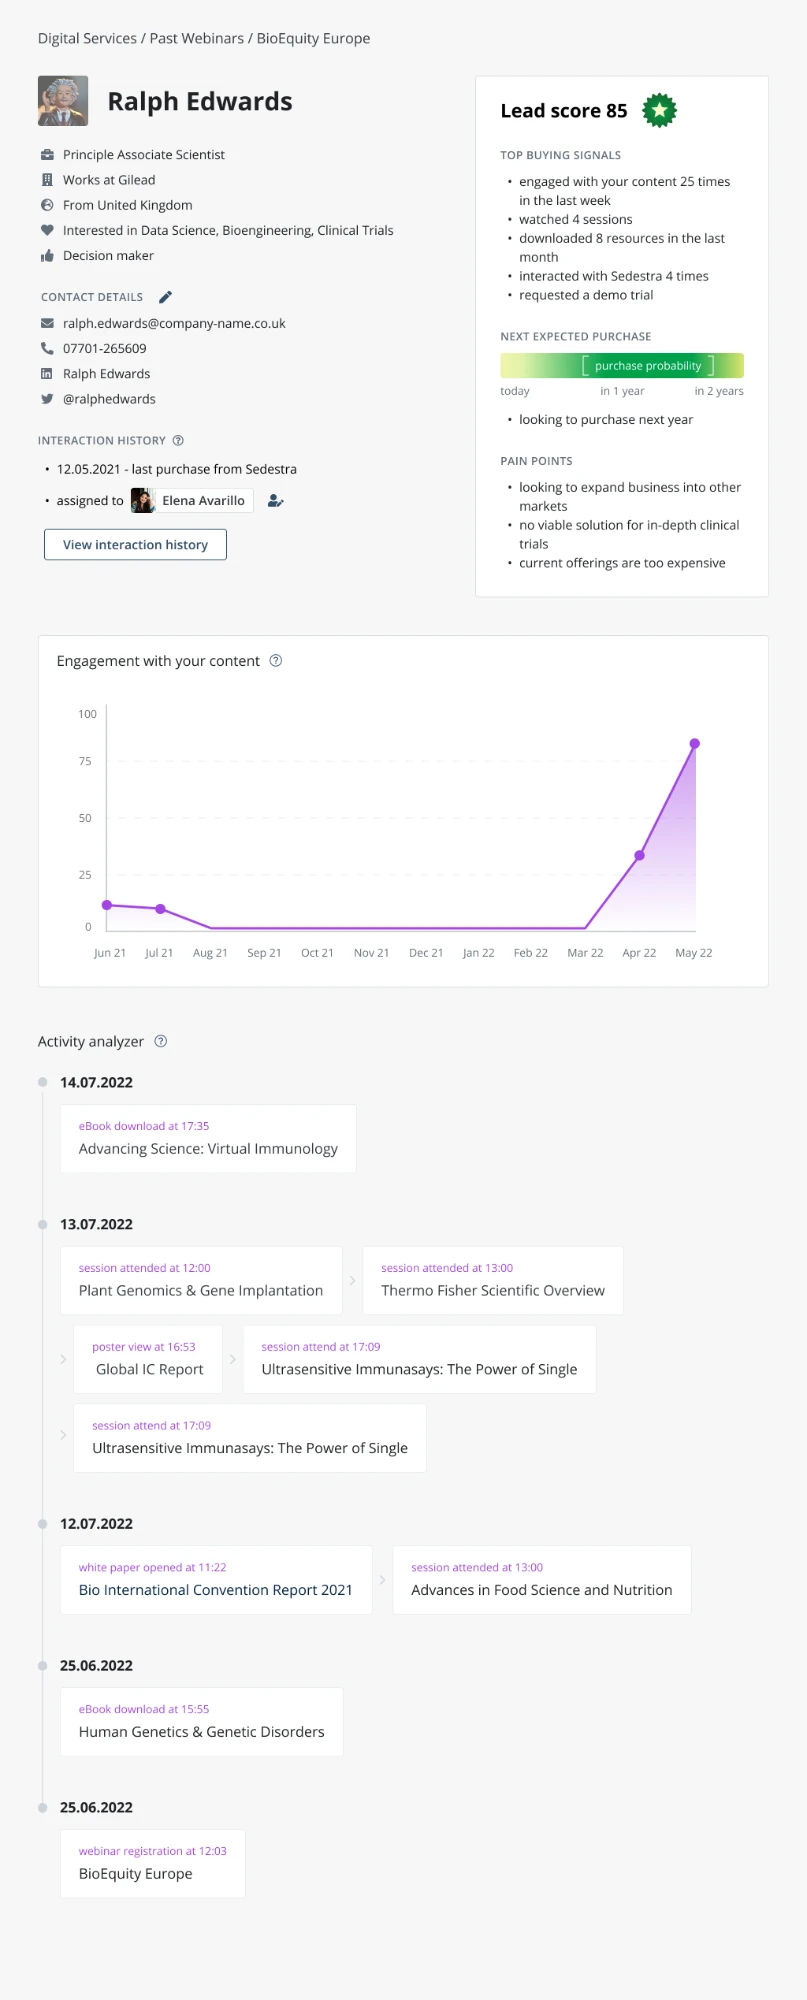
Lead Profile
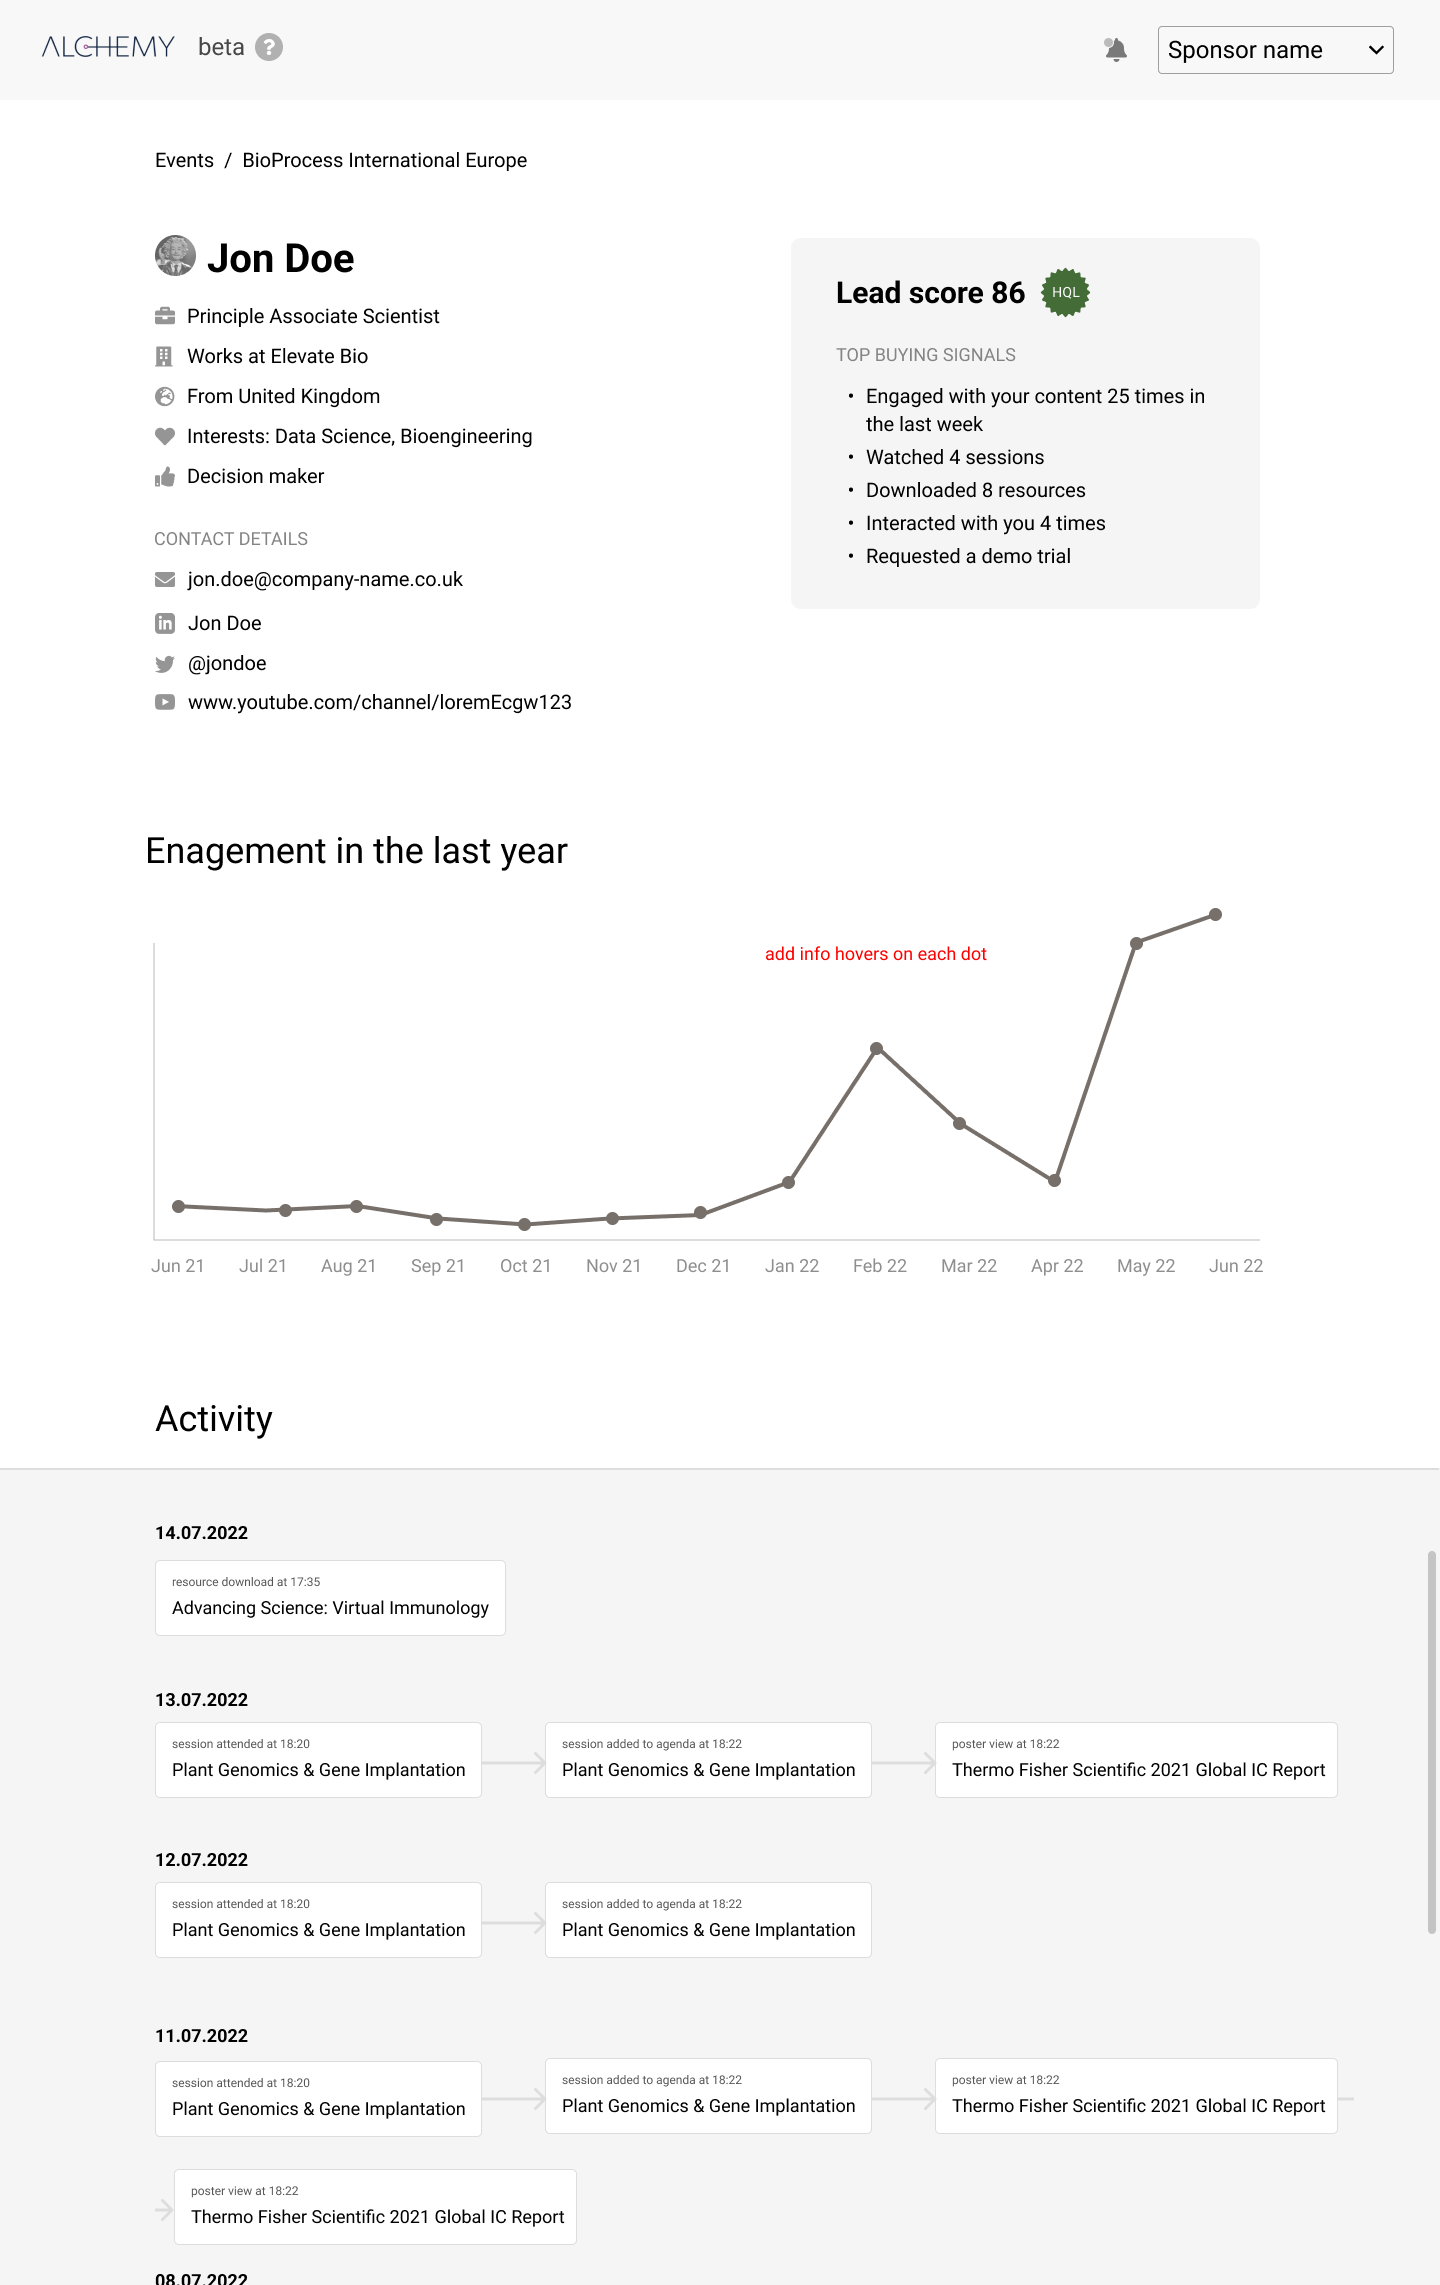
Everything we know about one lead, in one place. Research showed:
Context beats a name on a list.
History tells reps when to reach out.
Buying signals belong next to the next step.
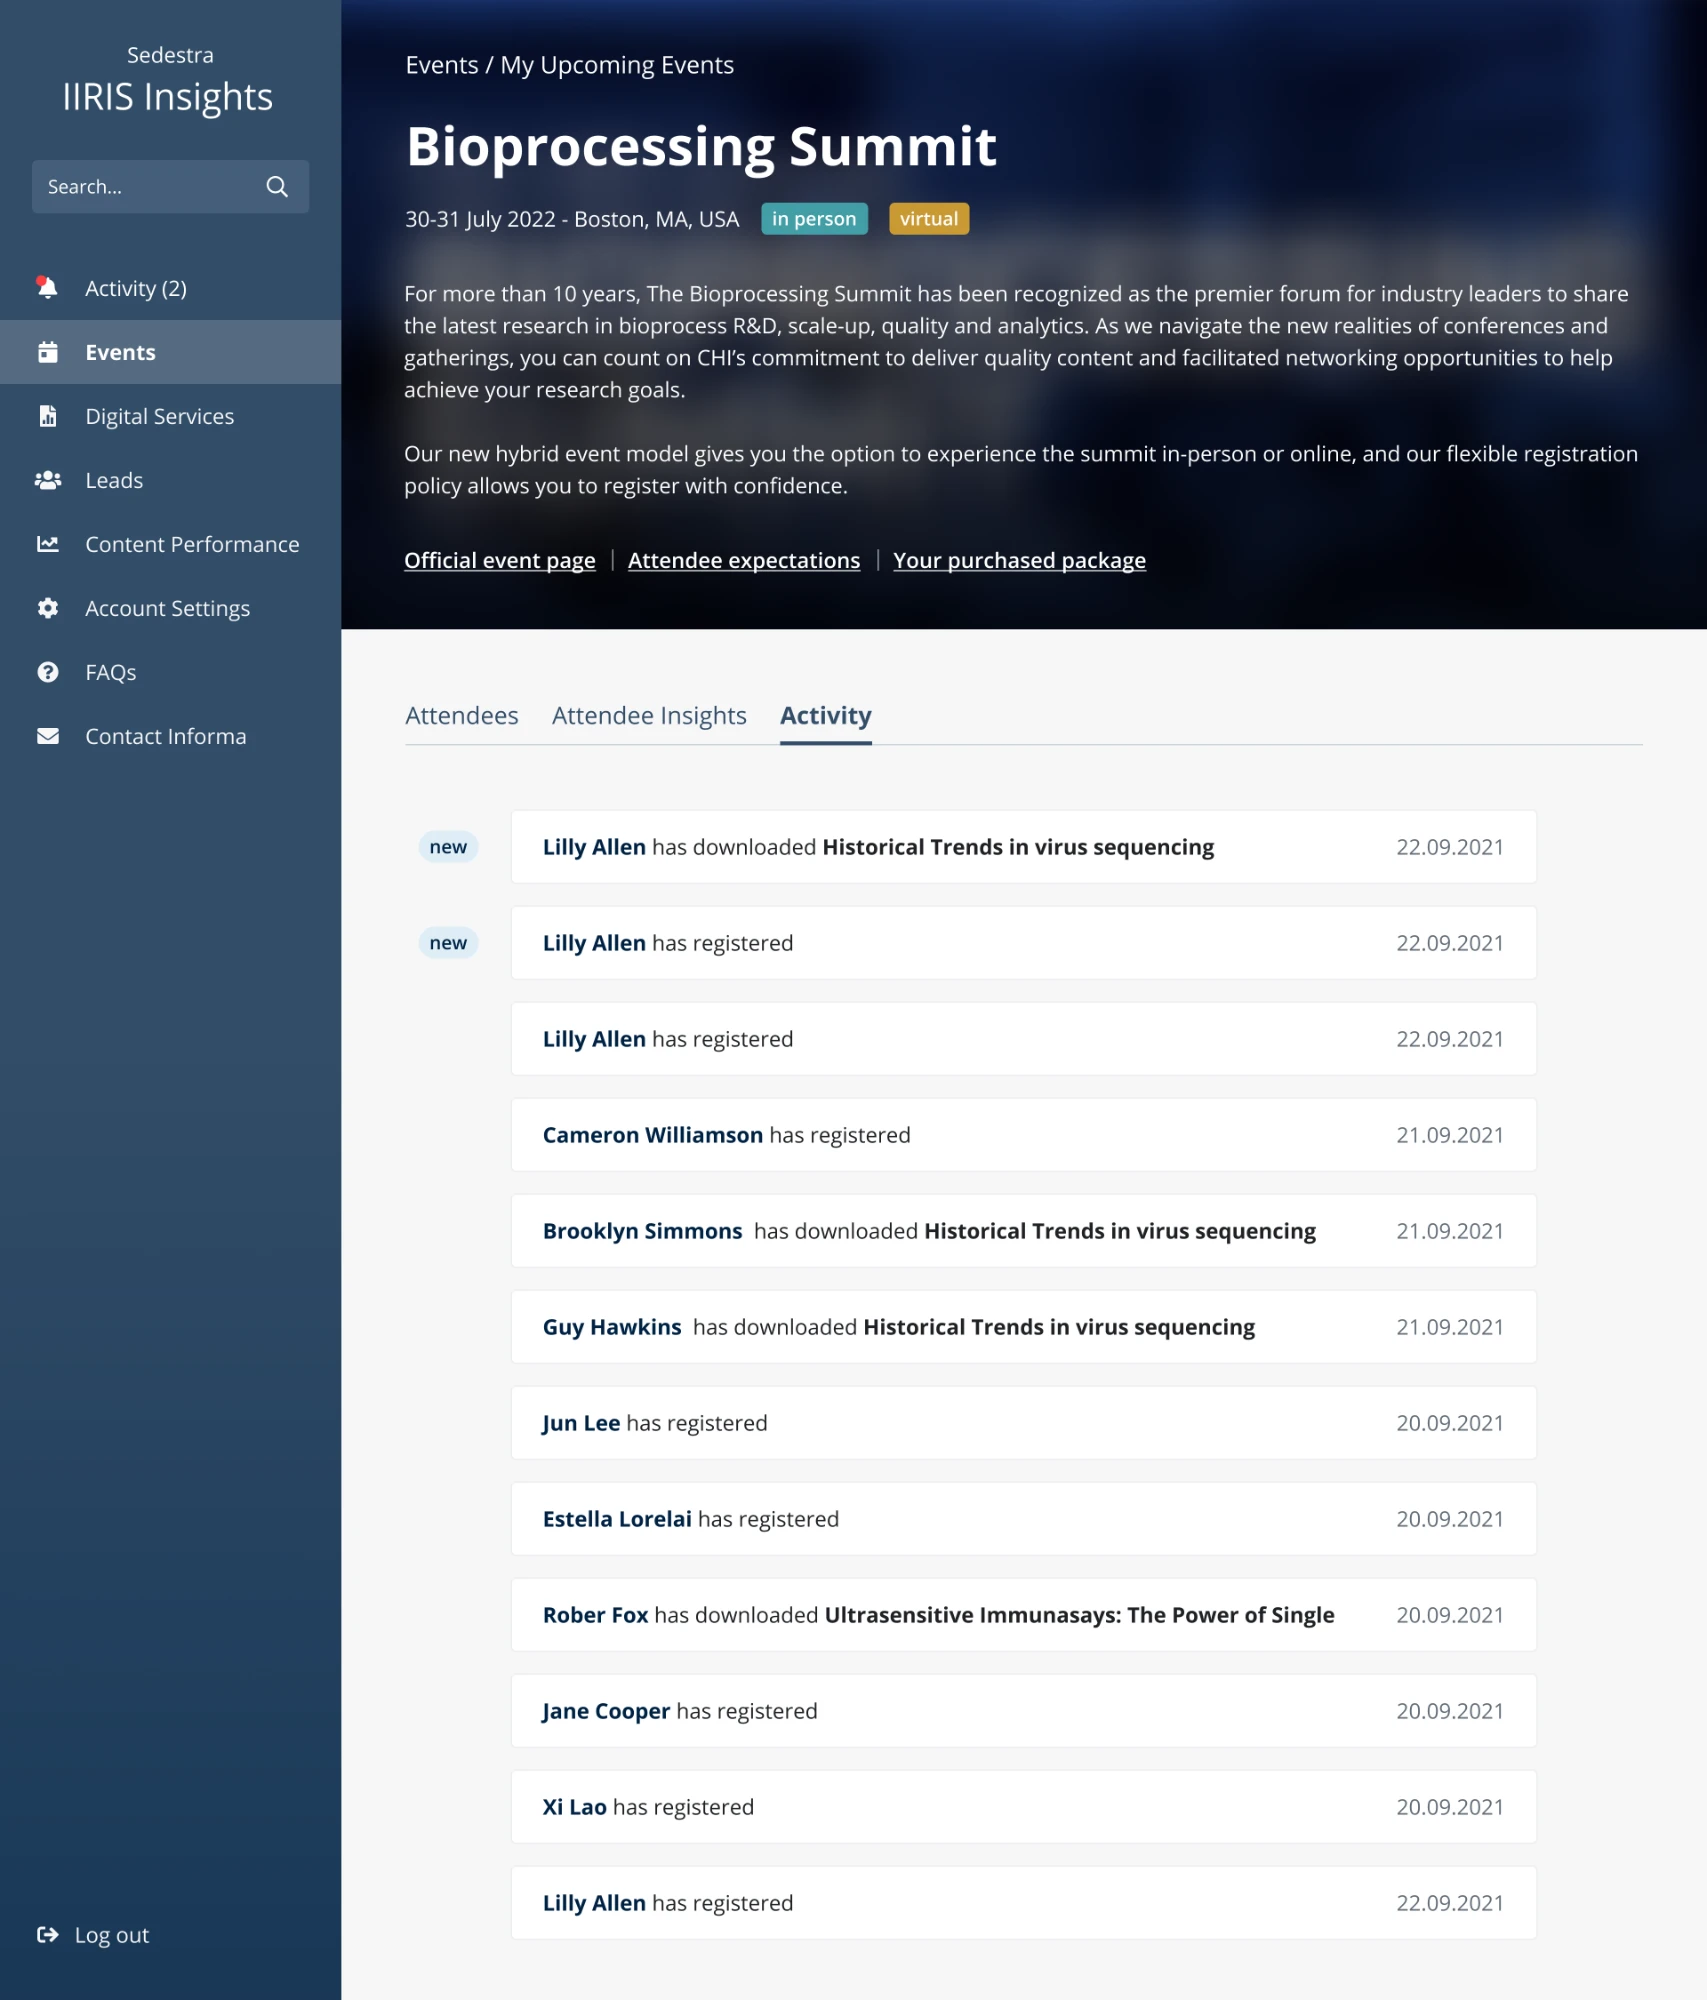
Events
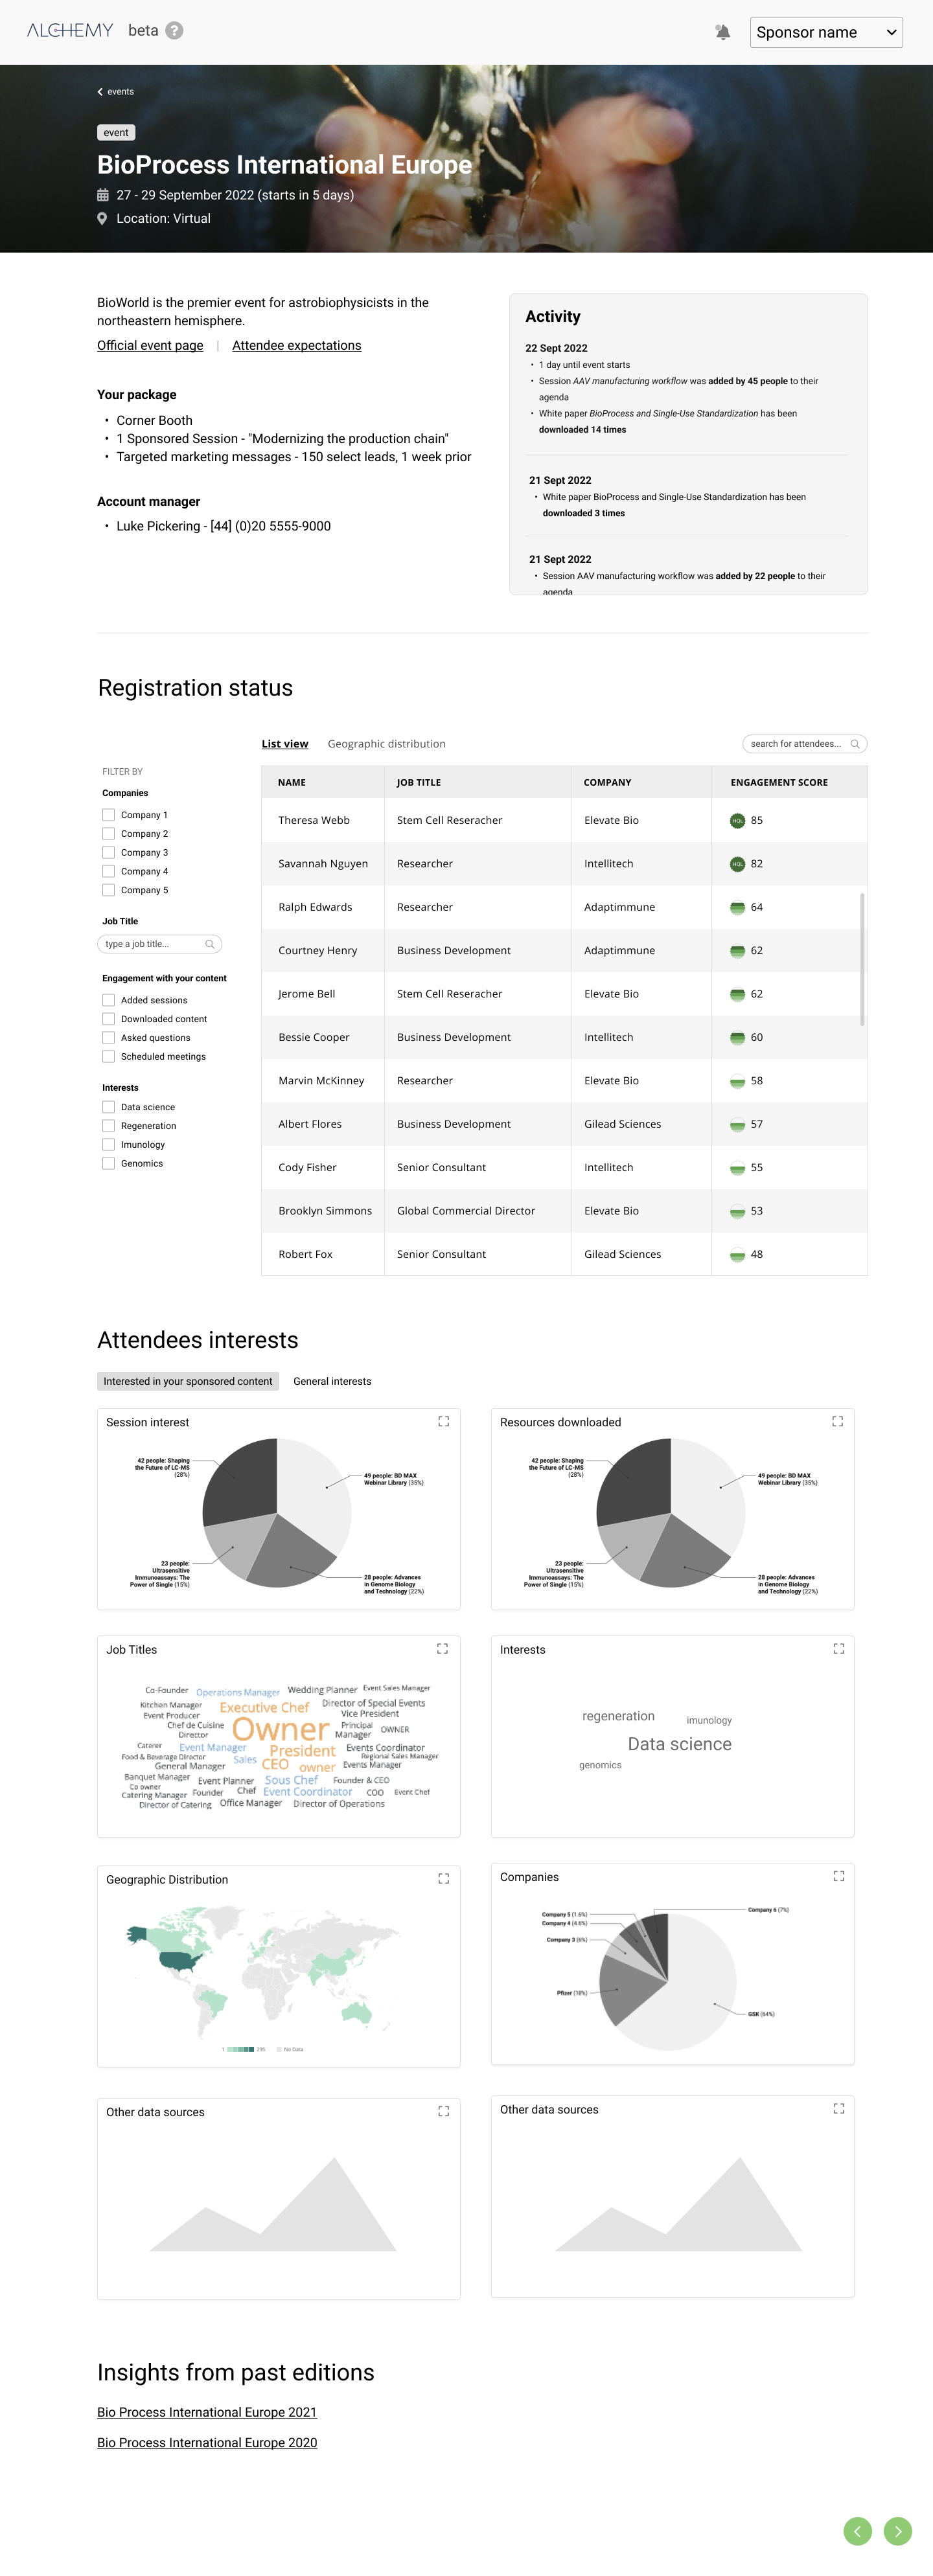
How a single event performed for my company. Research showed:
Registrations are the first signal.
Insights show who the event really draws.
Activity shows what they did with my content.
Content Performance
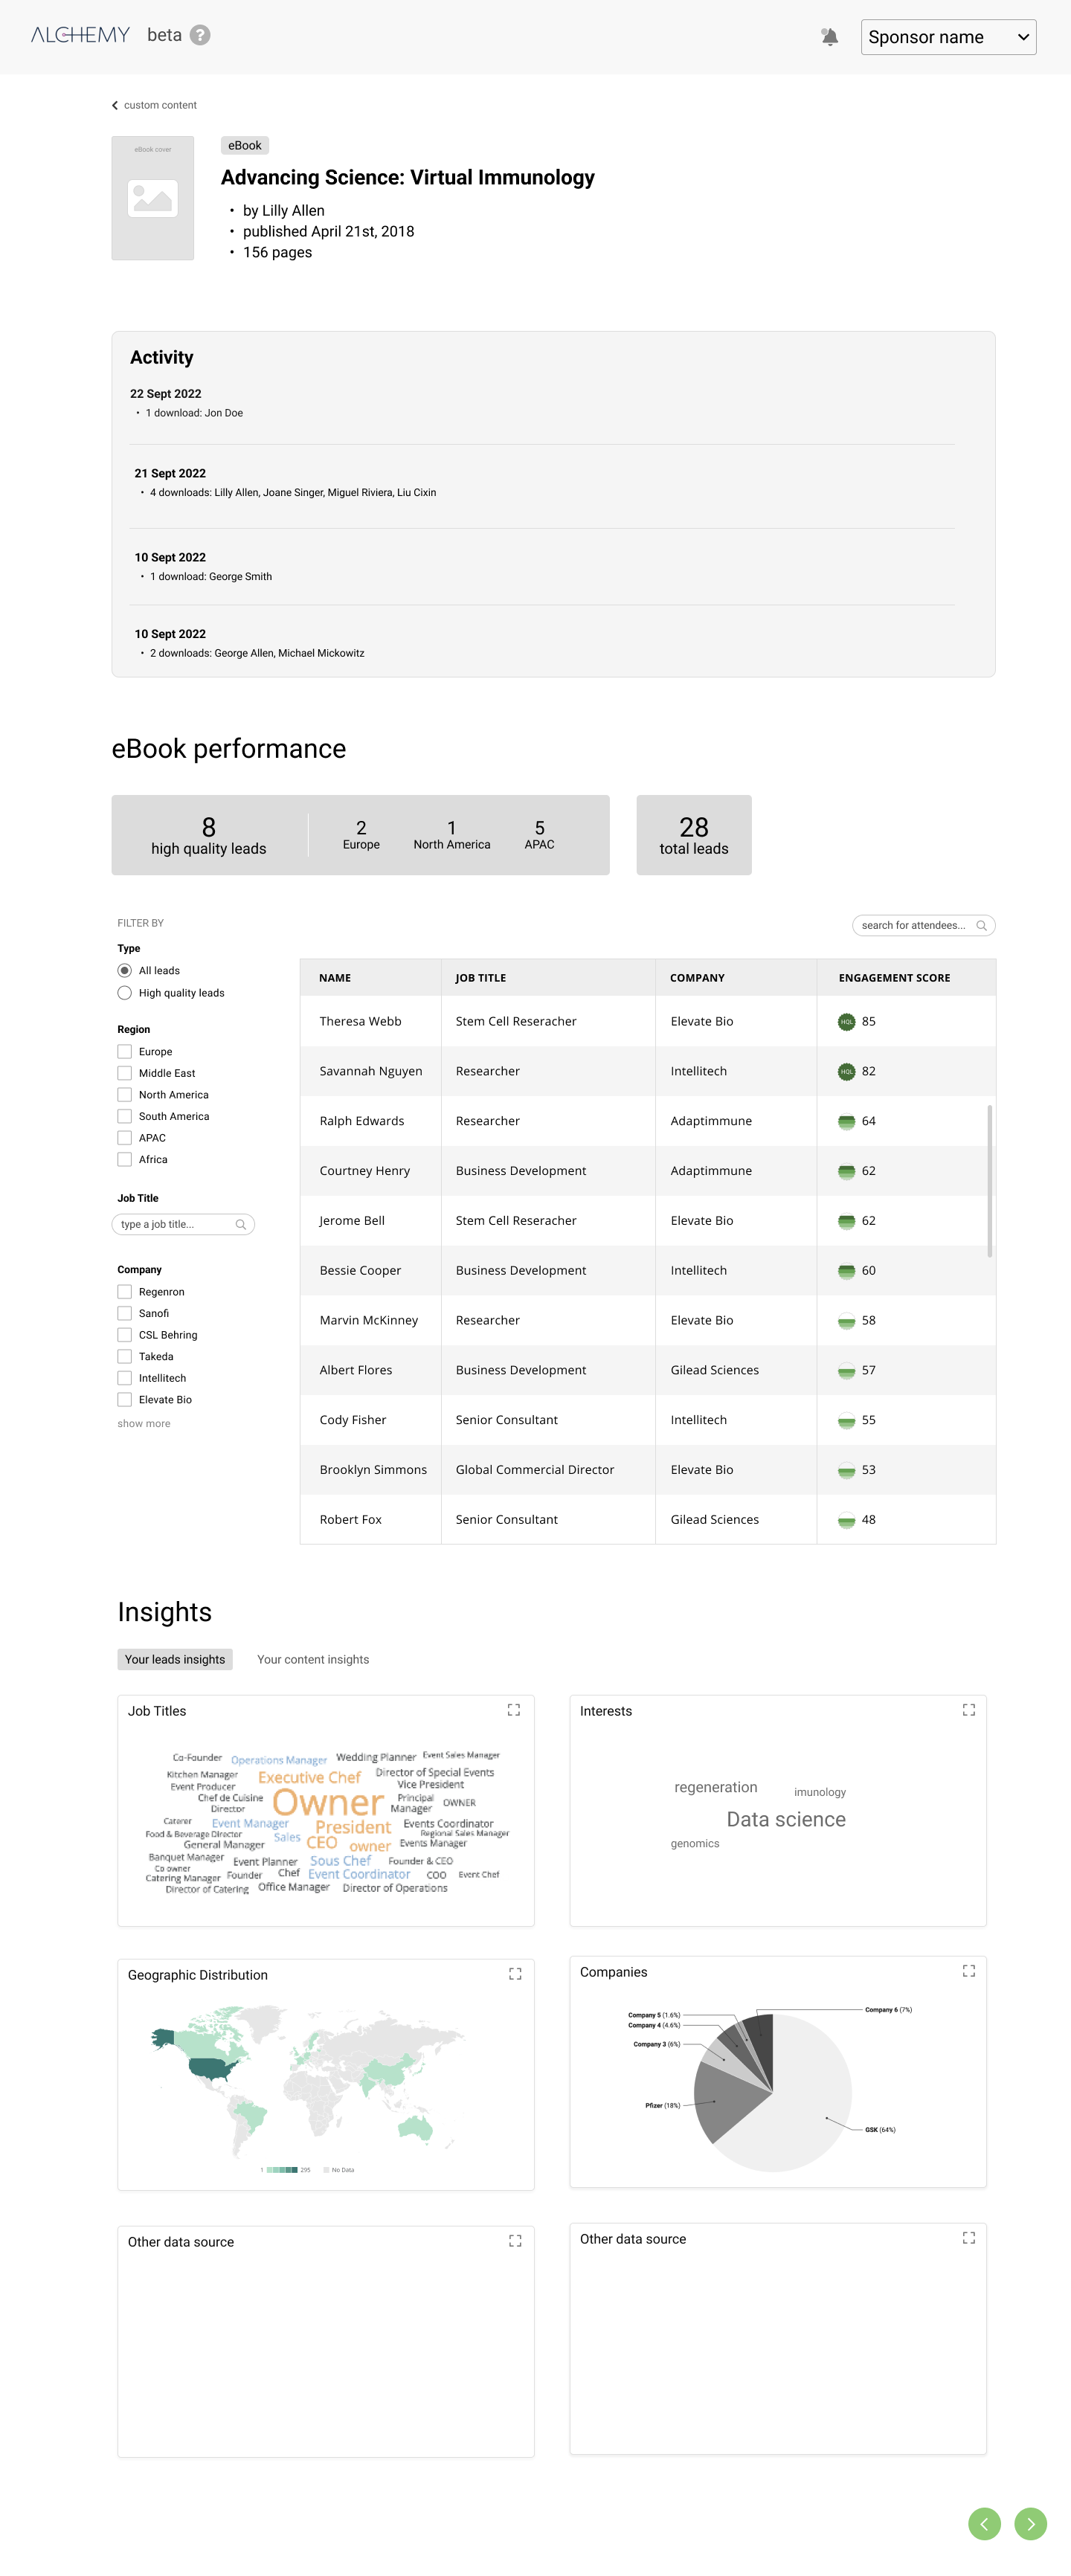
How my company’s content performs. Research showed:
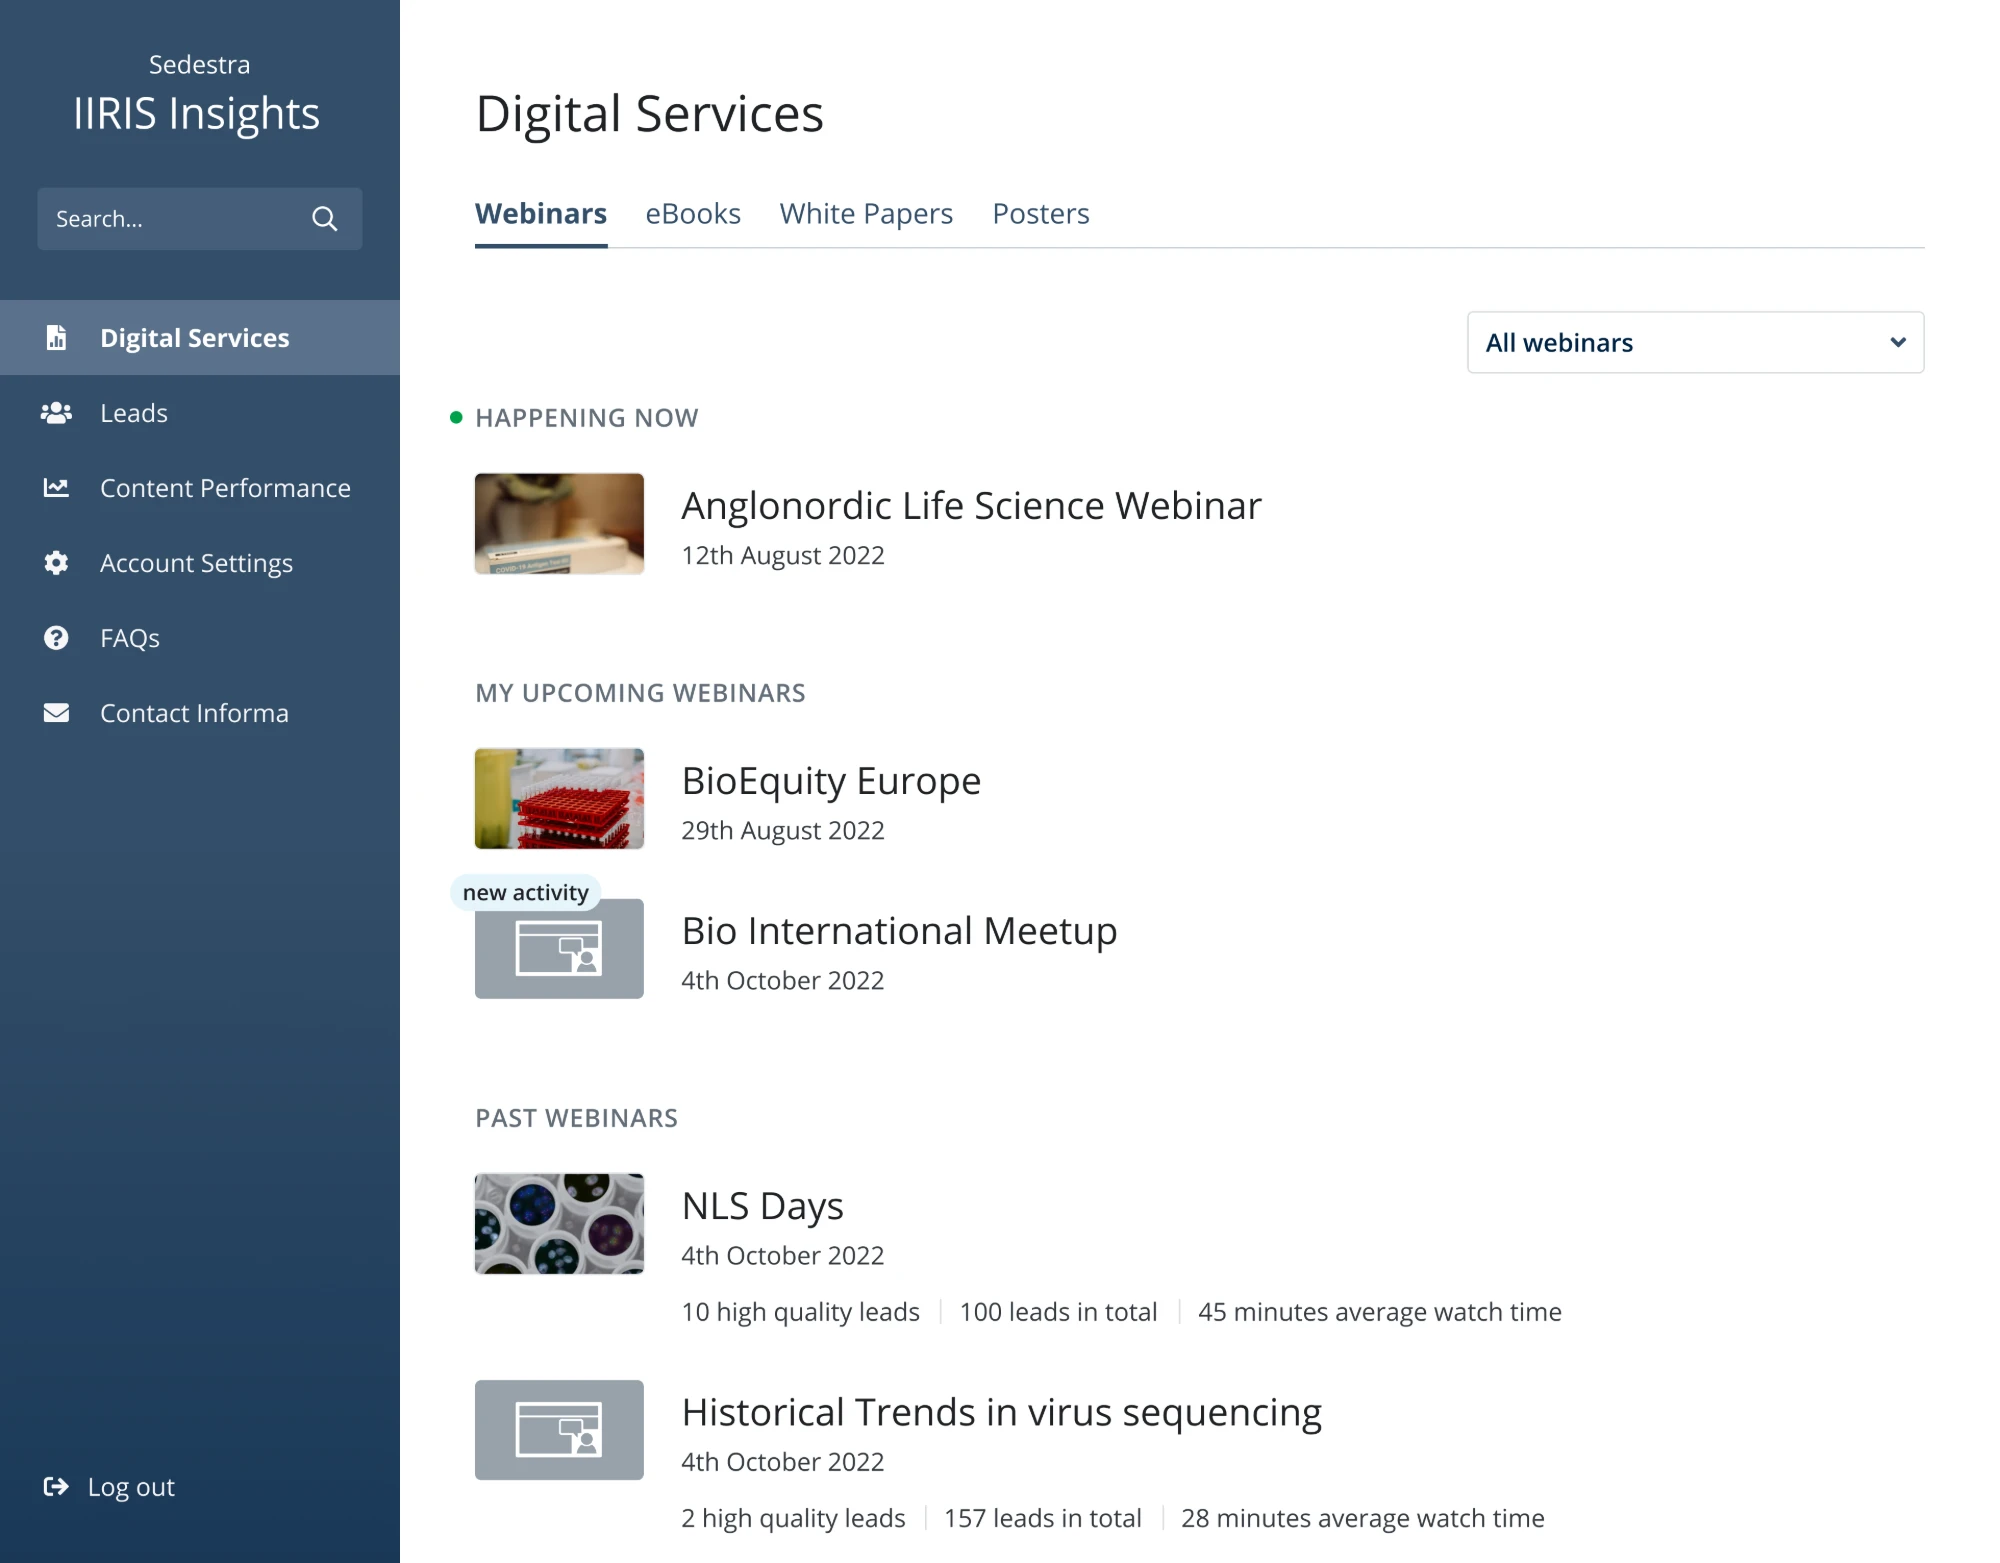
Webinars, eBooks, white papers and posters belong in one place.
What’s live, upcoming and past is clearest at a glance.
Leads and watch time show which content works.
Signal over noise
For users. Reps stop guessing which leads to chase. They open the dashboard already knowing where to focus.
For the company. Faster follow-up on high-value leads shortens sales cycles and lifts conversion rate.
From attention to intent
For users. Reps can tell instantly if they’re talking to someone with real authority — not just a name on a list.
For the company. Cuts wasted outreach on low-authority contacts, improving rep productivity and pipeline quality.
Who’s actually showing up
For users. Marketing sees the “who” behind the numbers without manually cross-referencing CRM exports.
For the company. Enables account-based targeting and upsell within existing high-value accounts.
Where the interest comes from
For users. Sales and marketing see which regions engage most, so territory plans follow the data instead of assumptions.
For the company. Shows which markets respond to which events, informing where to run the next ones.
What they care about
For users. Reps open the conversation with the topic and industry a lead already cares about, not a generic pitch.
For the company. Reveals which topics and sectors keep drawing attention, feeding future event programming and content.
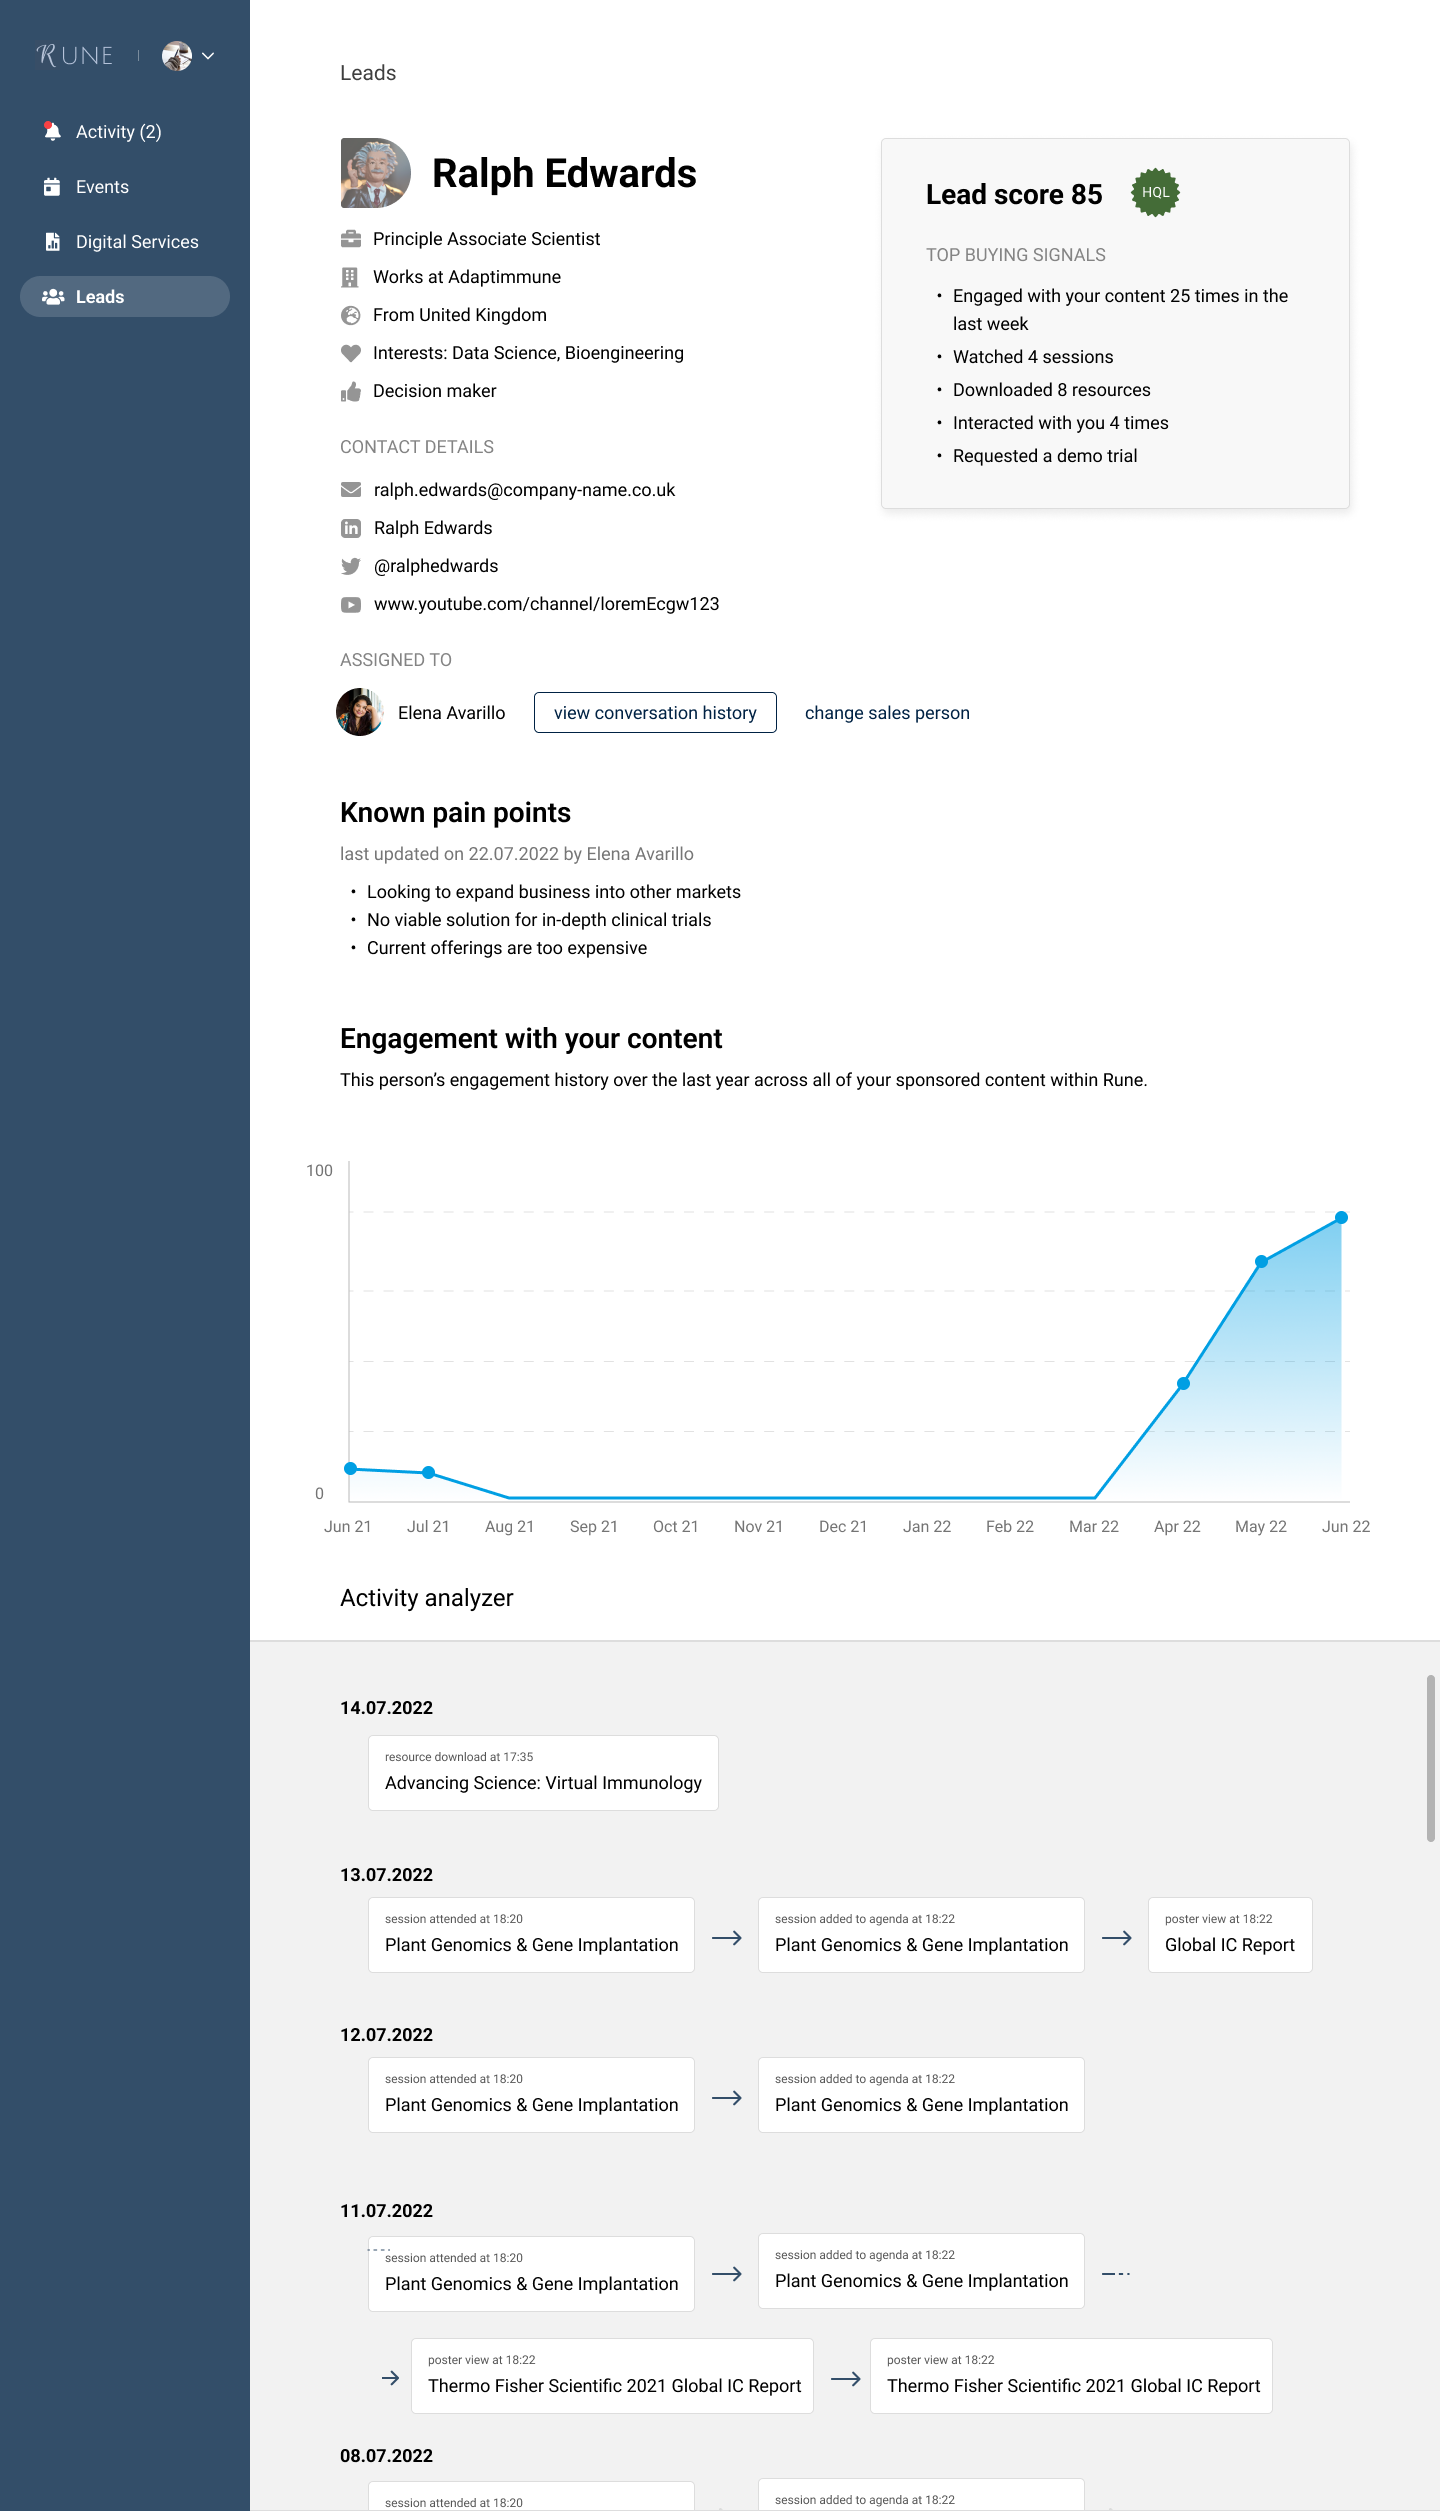
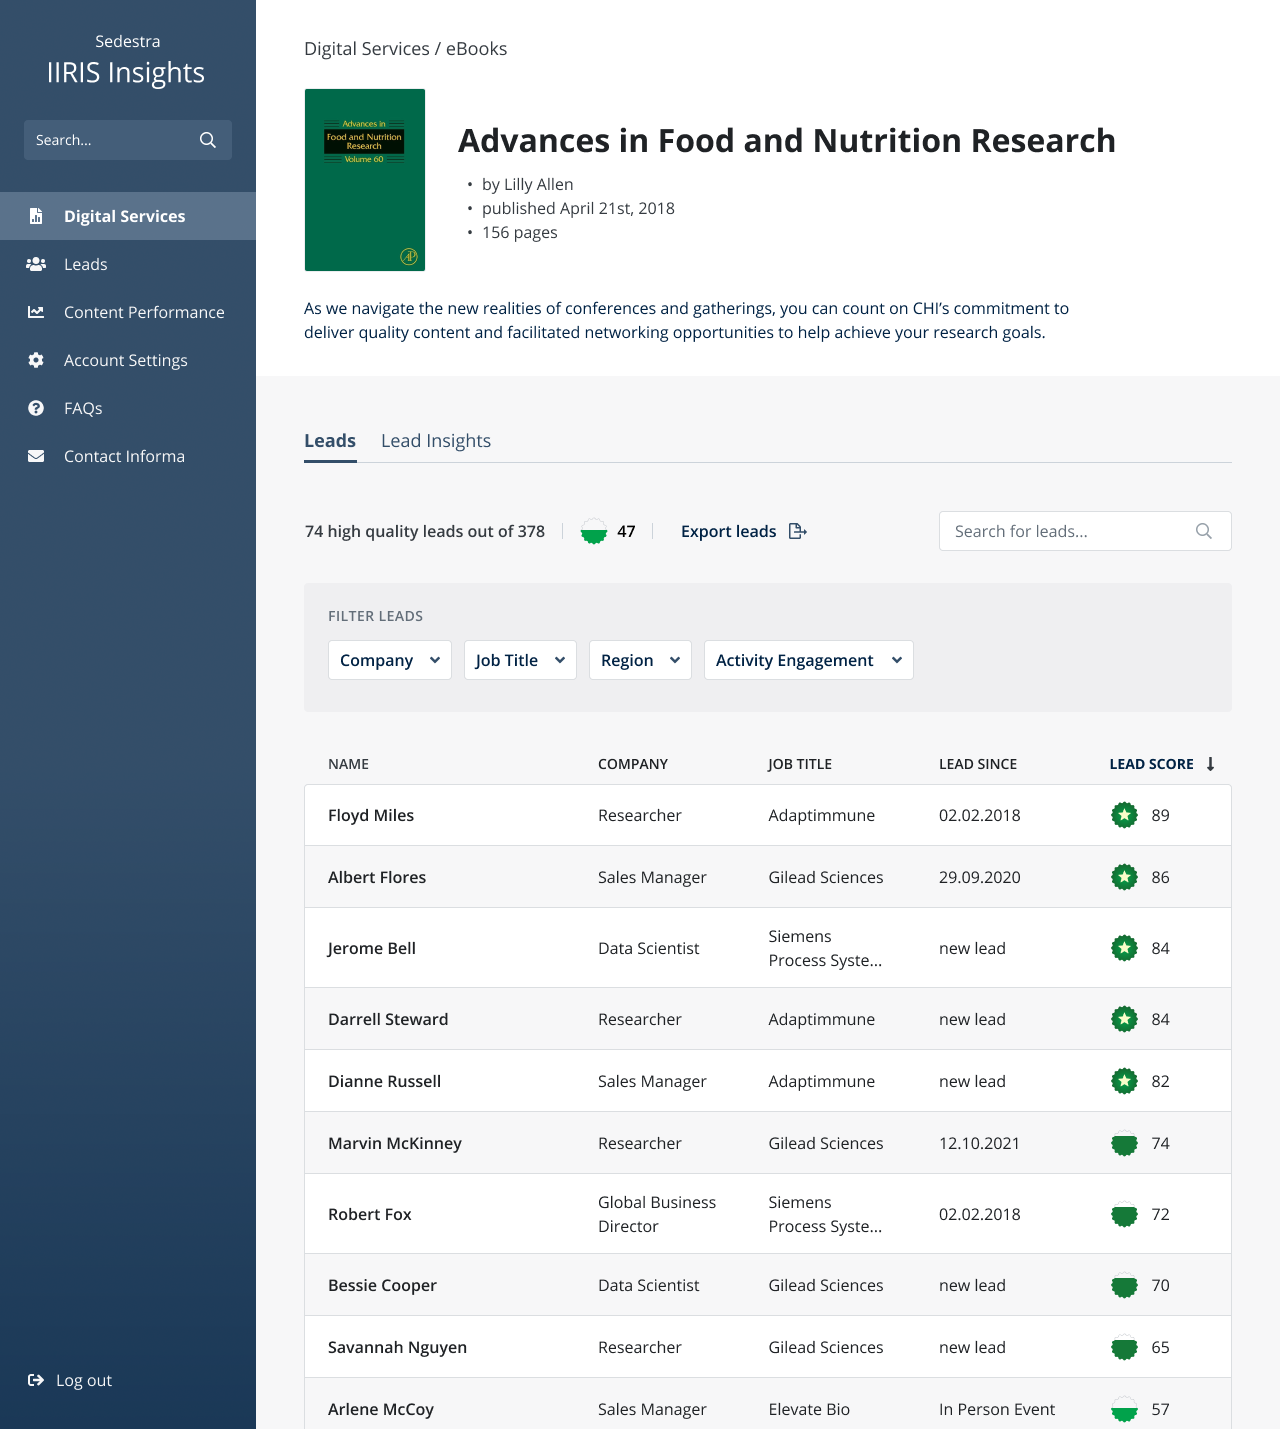
What we know about each lead
Information captured for each lead in the aftermath of their interaction with various touchpoints, physical and digital, gathered on one profile.
Our history with this lead
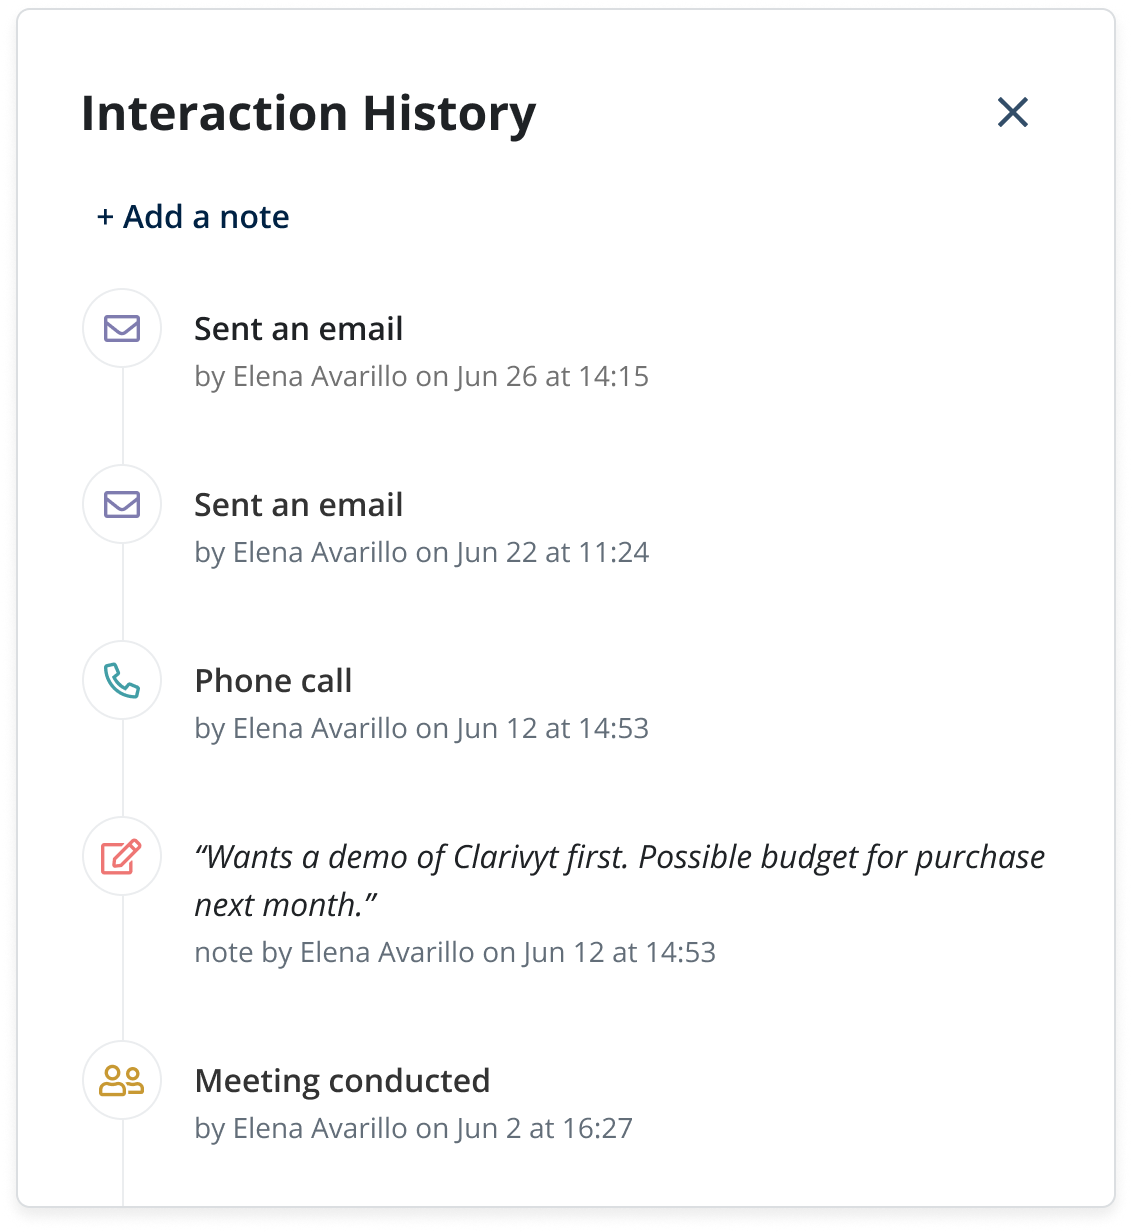
The interaction history of my company with this lead: every email, call, note and meeting, and who handled it, so nobody repeats a conversation.
Lead score and purchase probability
The lead score is the Insights view specific to your company. Next to it sits the purchase probability, which shows when this lead is most likely to buy. It turned out to be the big insight.
Engagement with your content
Engagement comes through many touchpoints: conferences, physical or digital, and digital content such as ebooks, posters, white papers and webinars.
Activity analyzer
A timeline of how this lead interacted with the company’s content, from ebook downloads to sessions attended, in the order it happened.
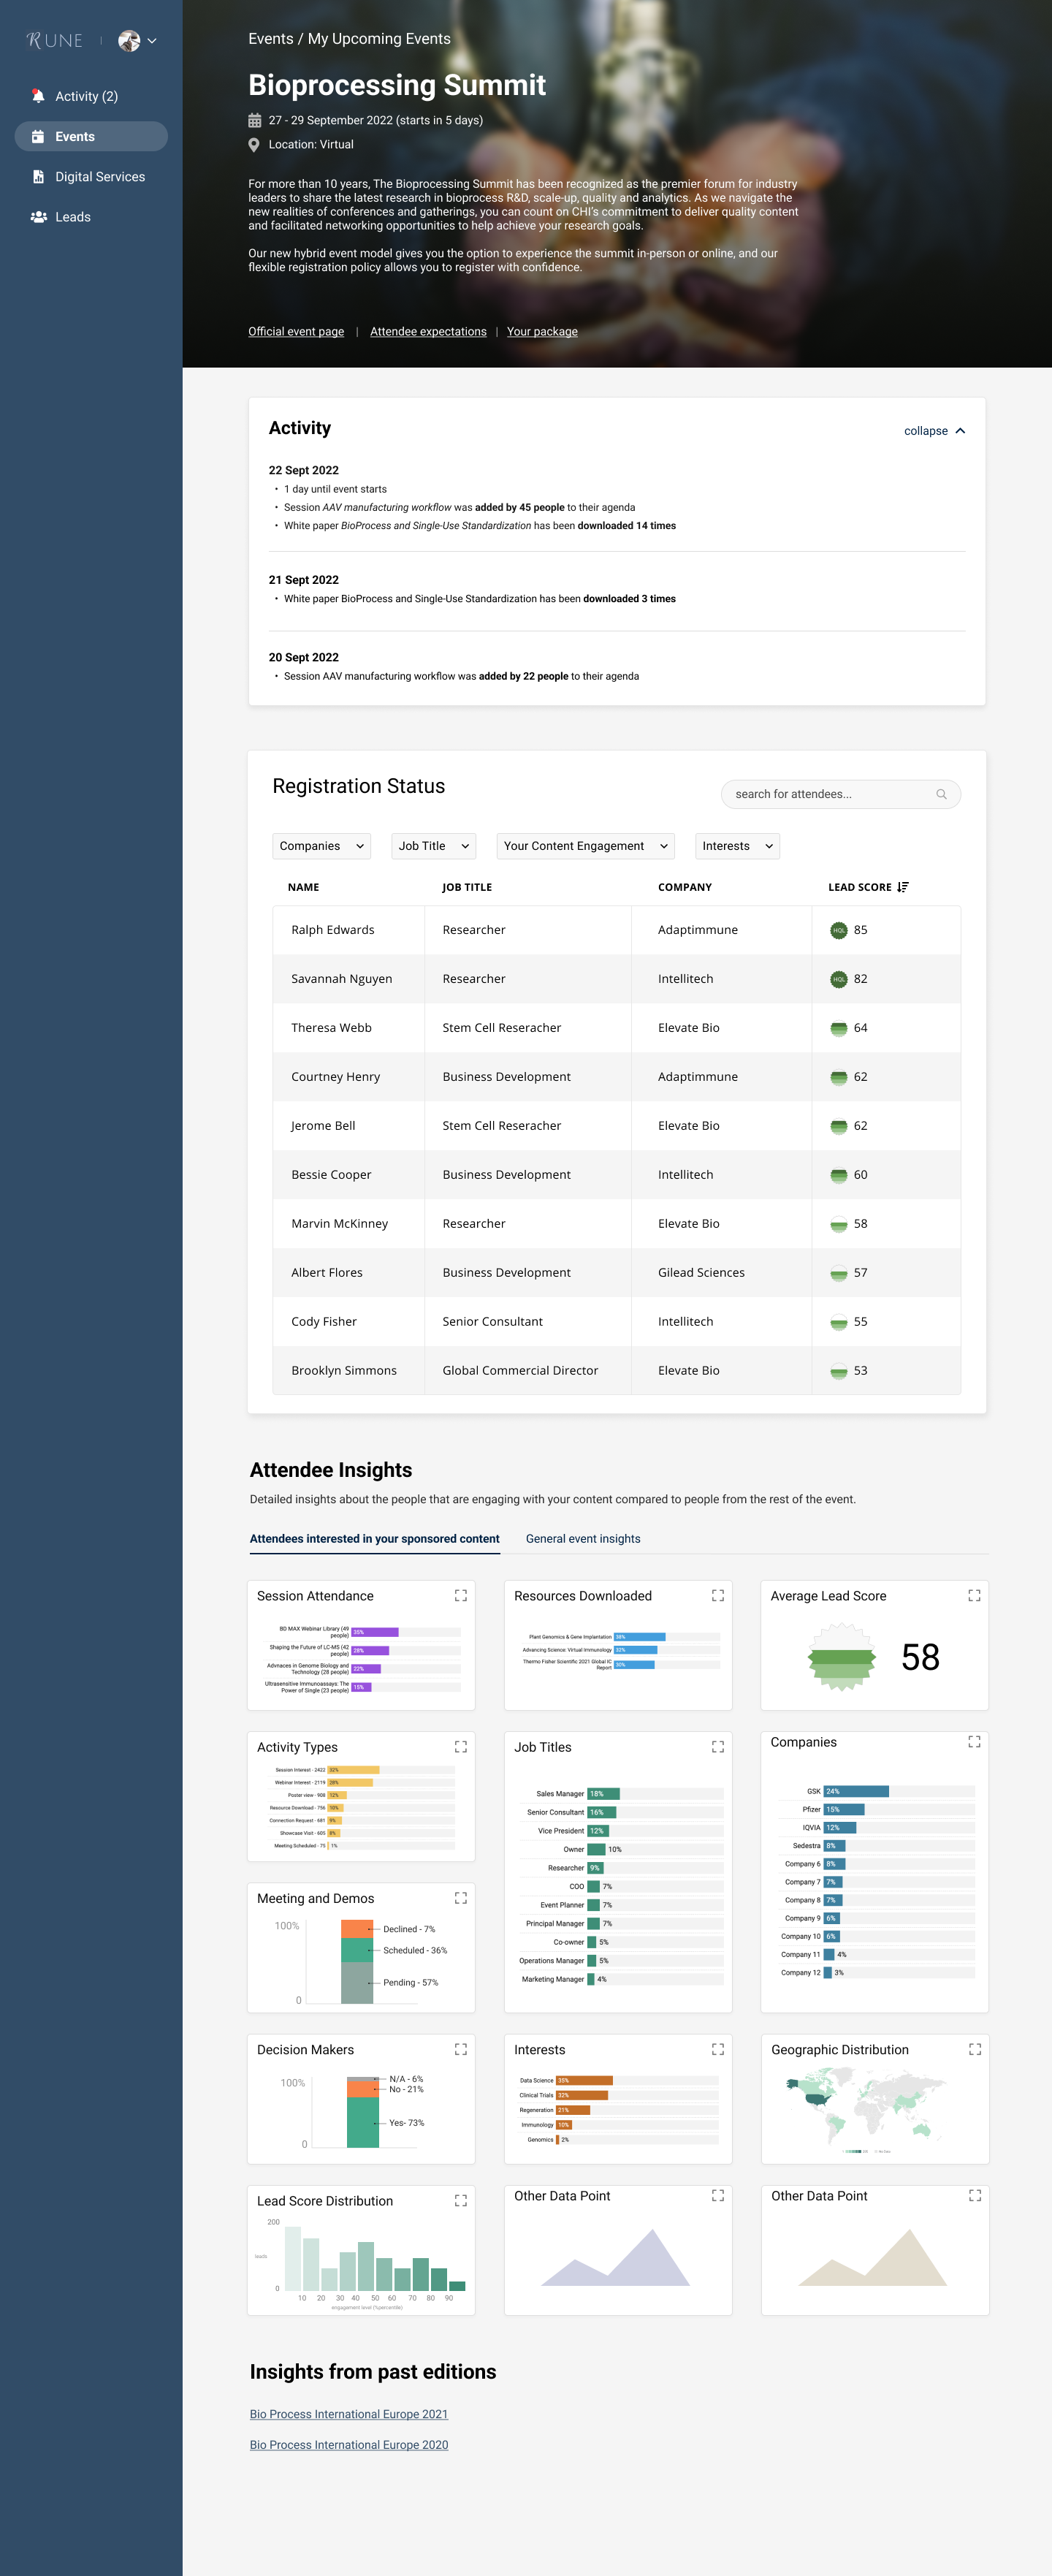
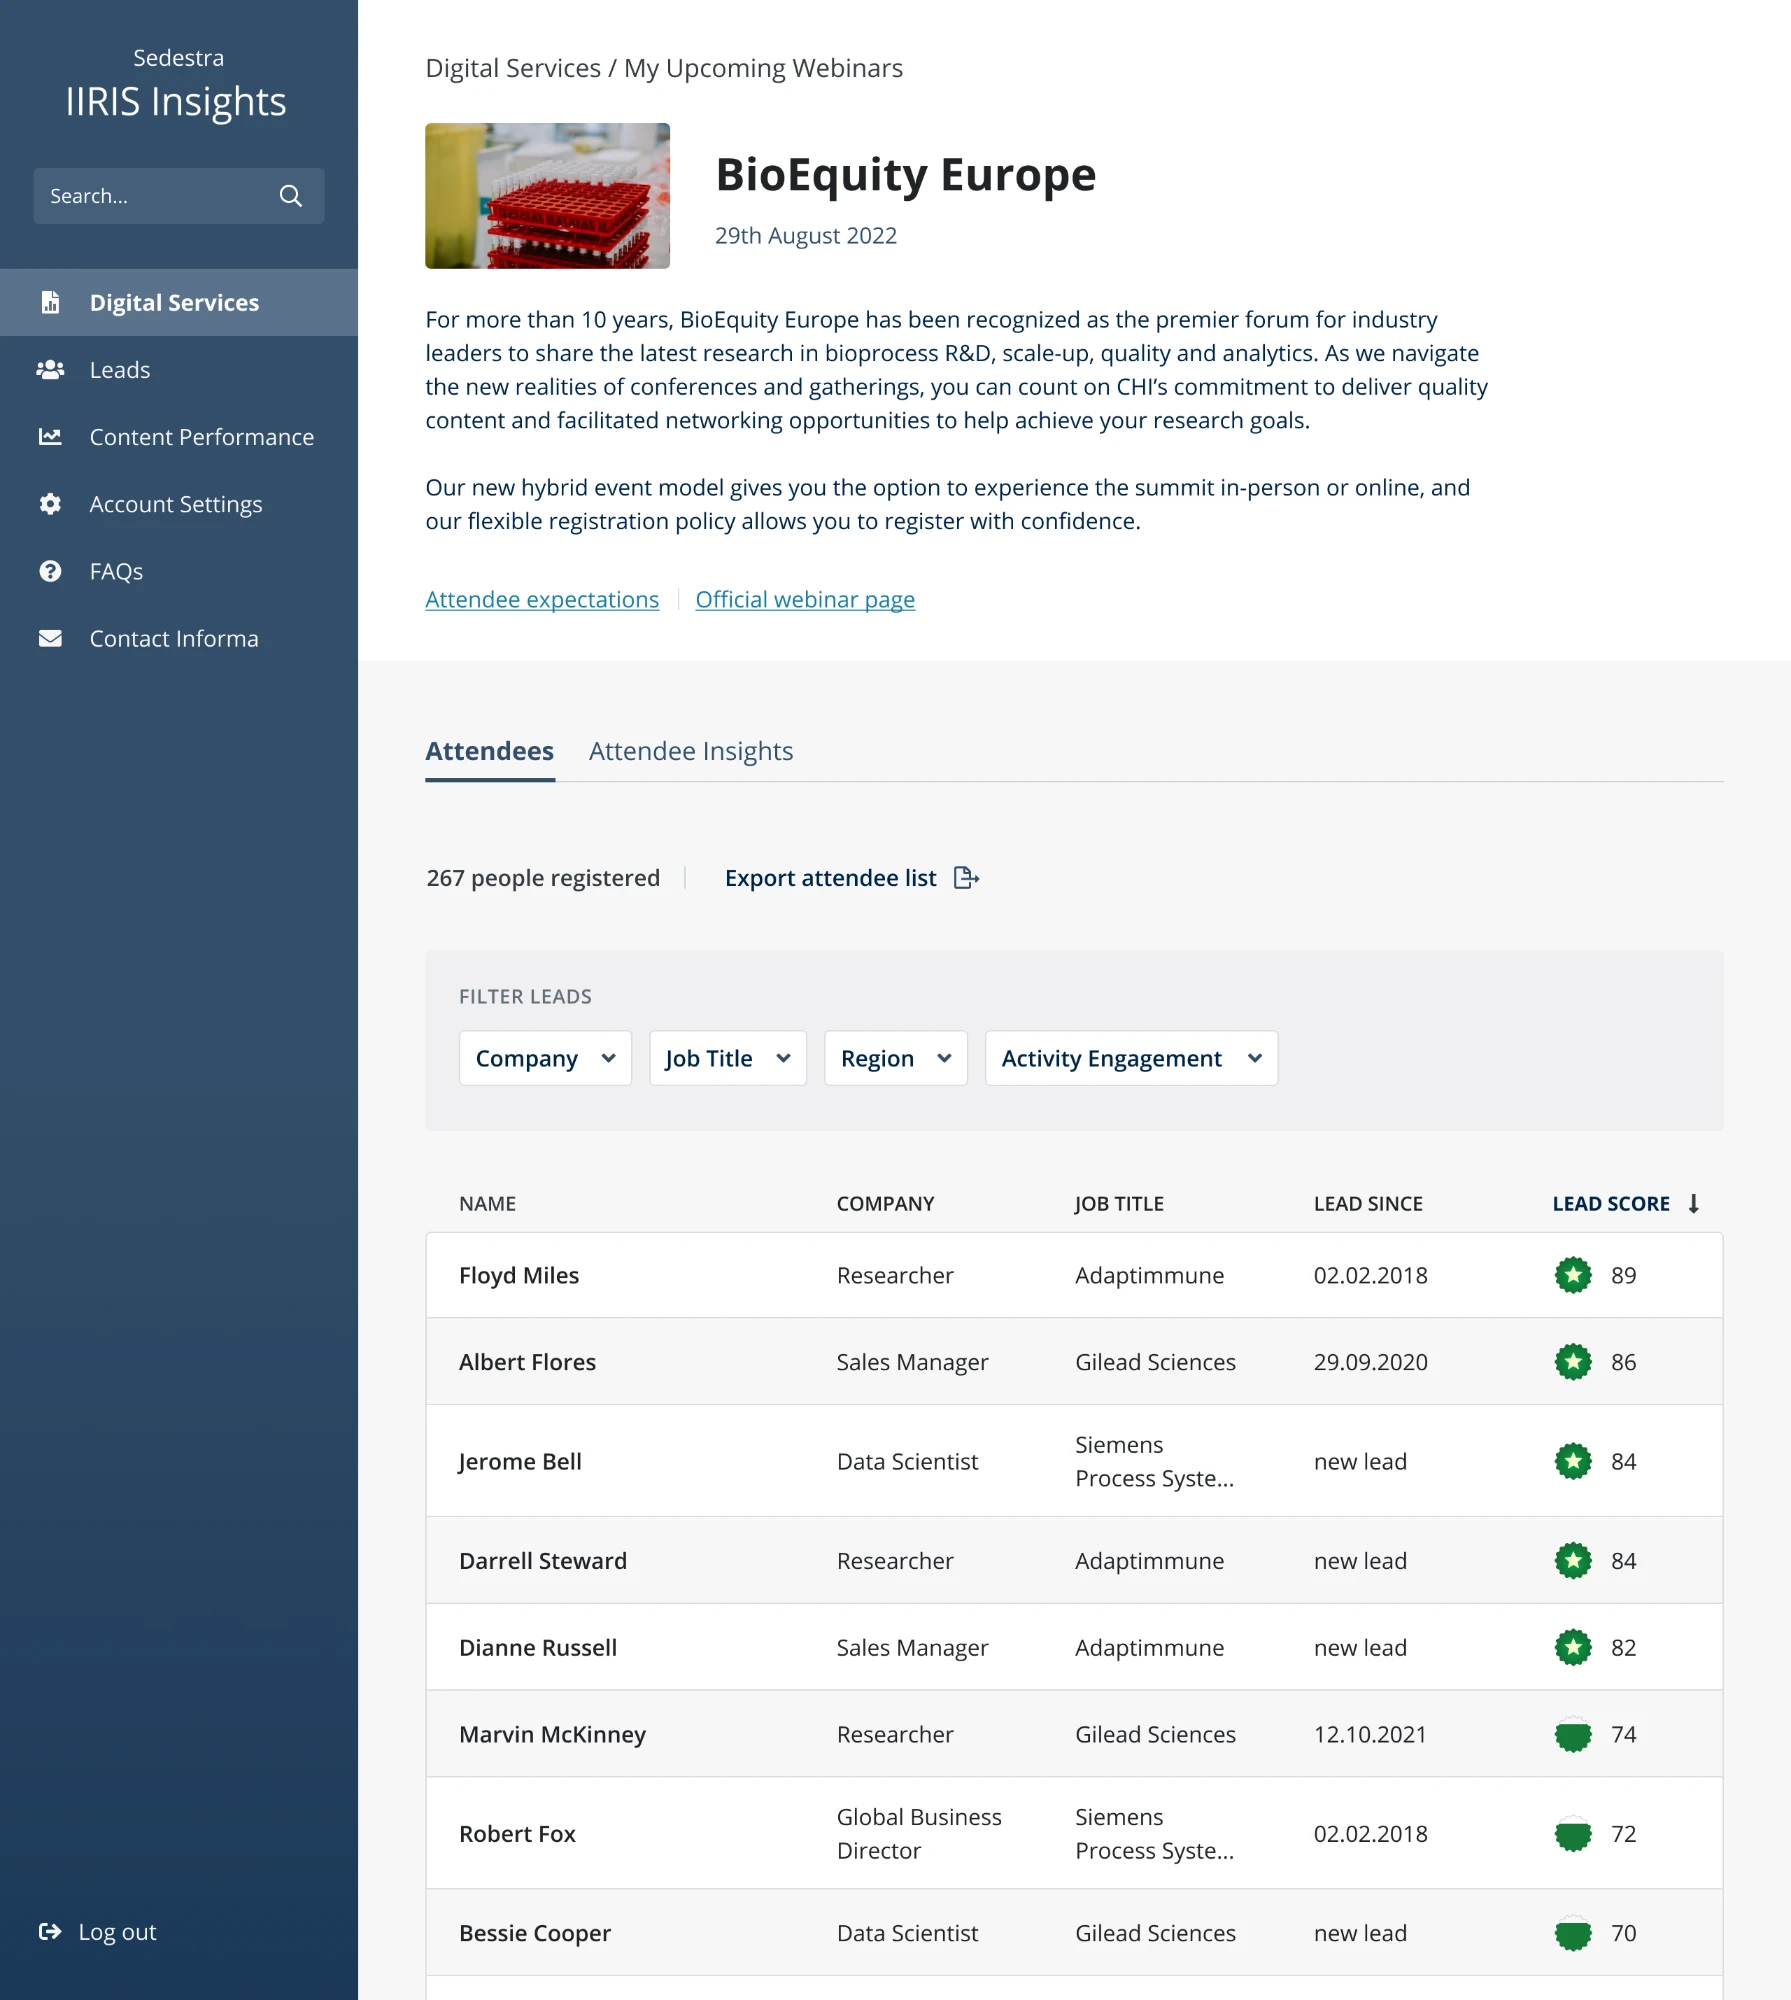
Who registered
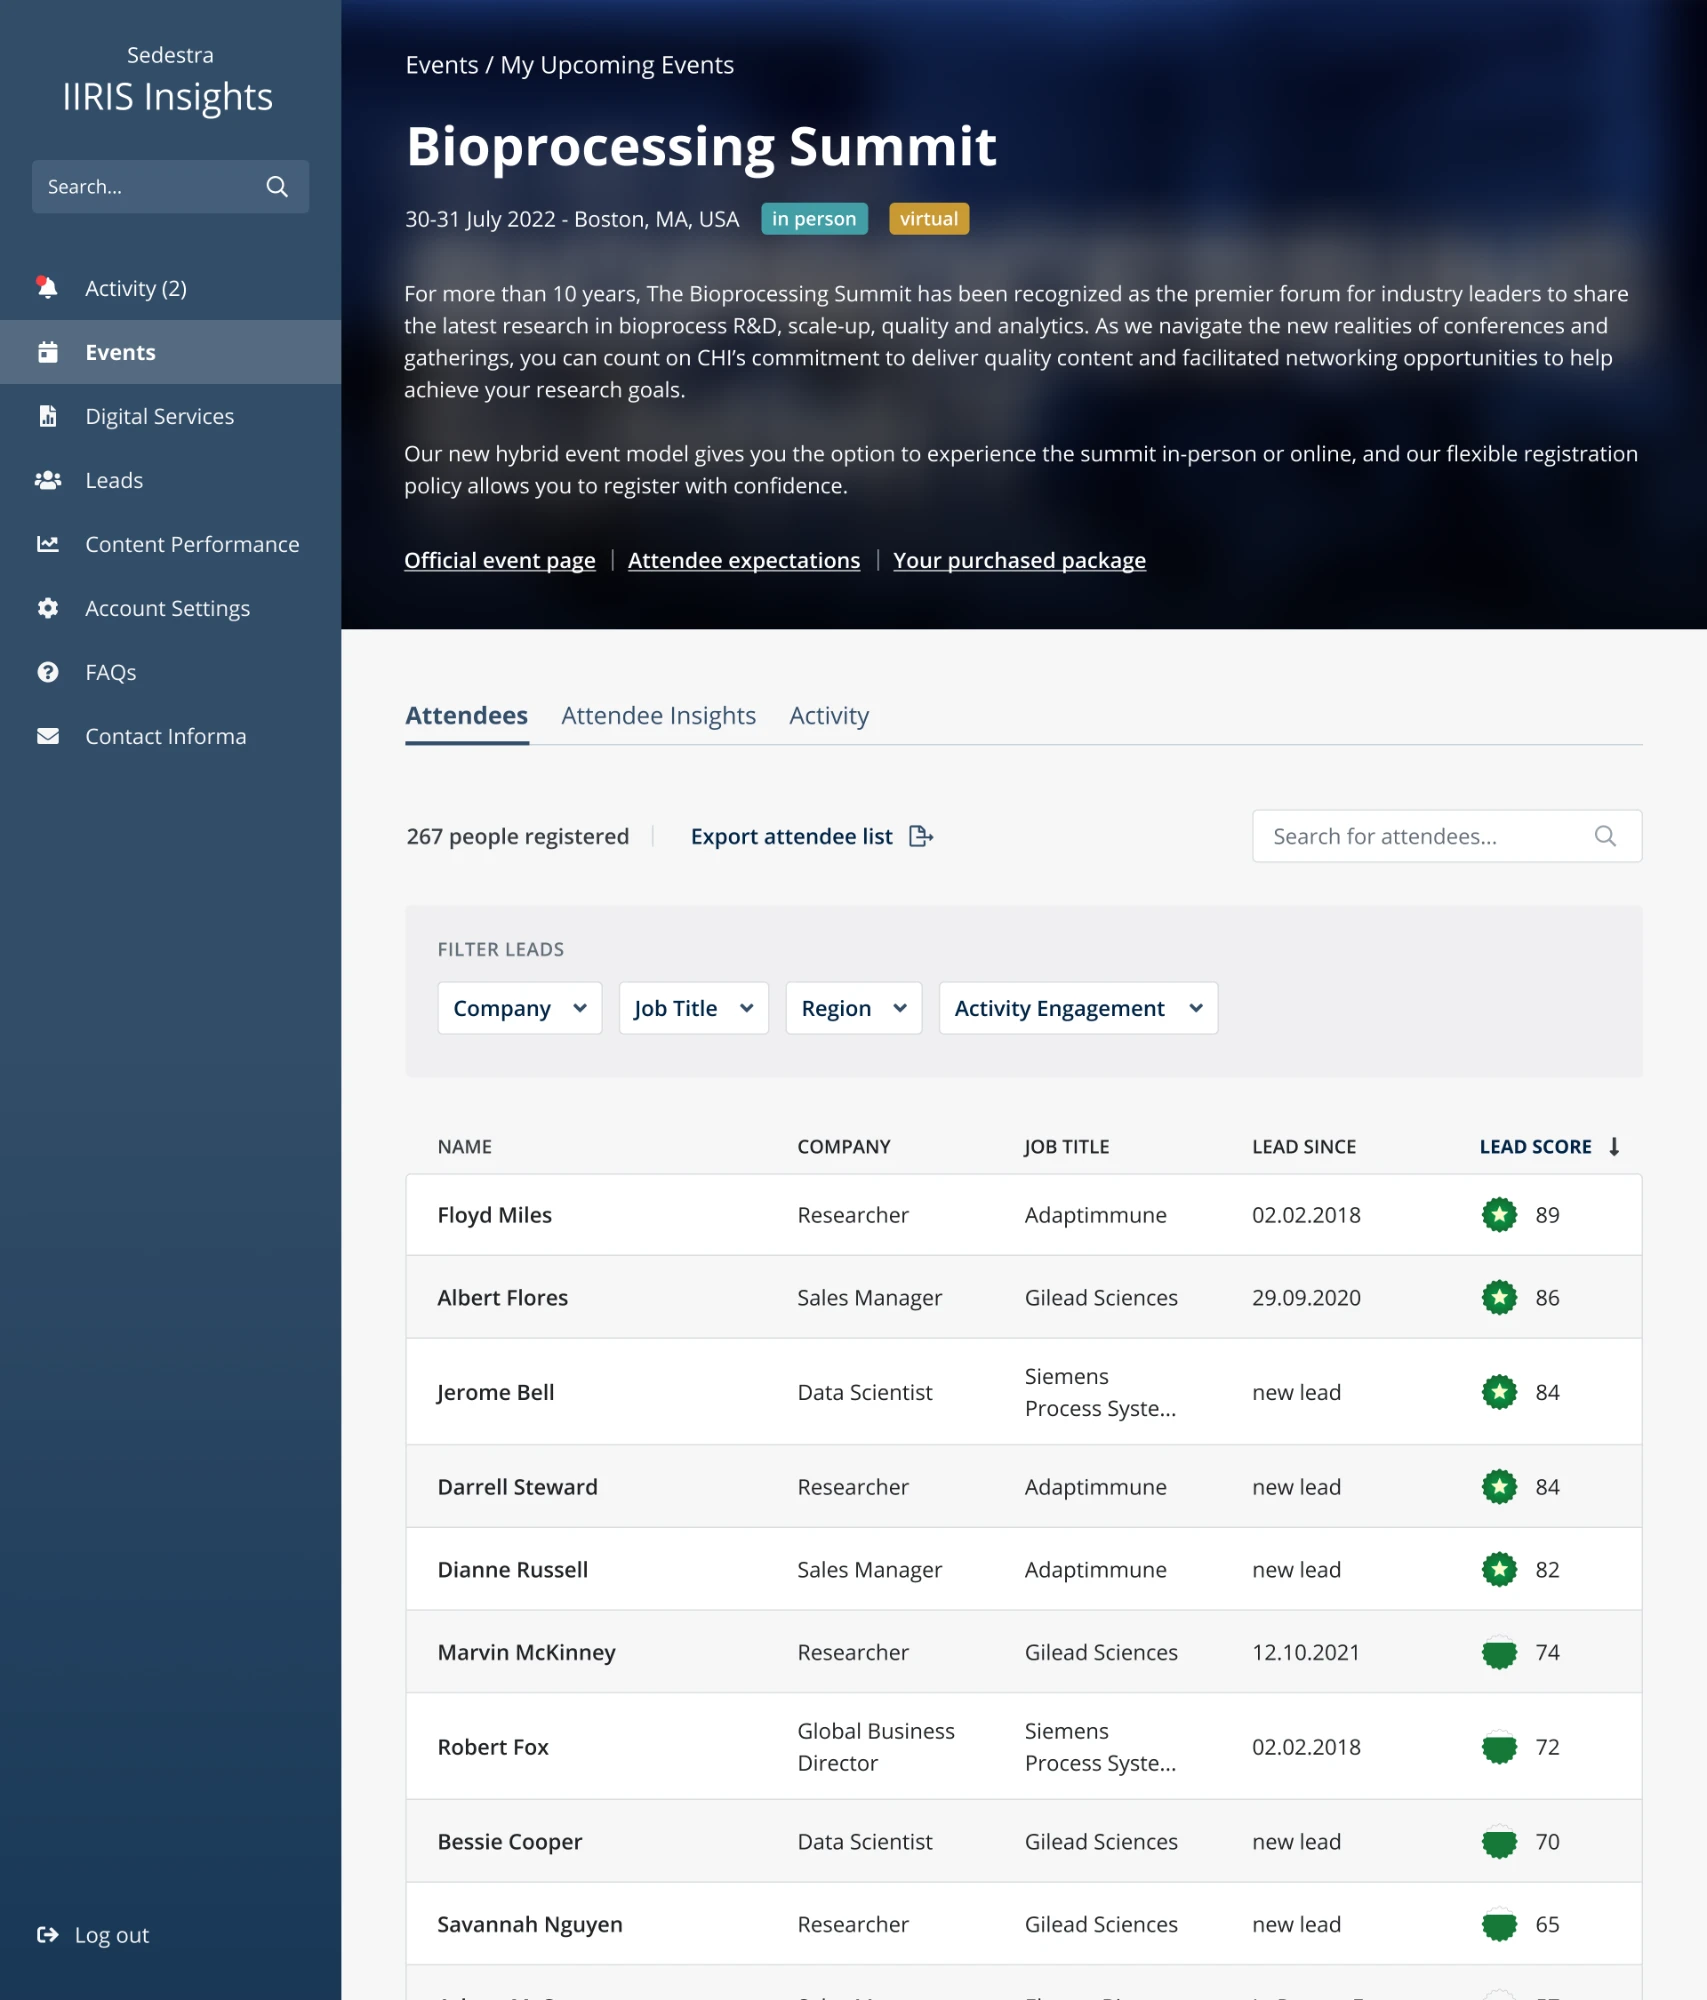
The event’s registered attendees, each with a lead score. The score is specific to each company, so what I see here is the one that’s relevant to my company.
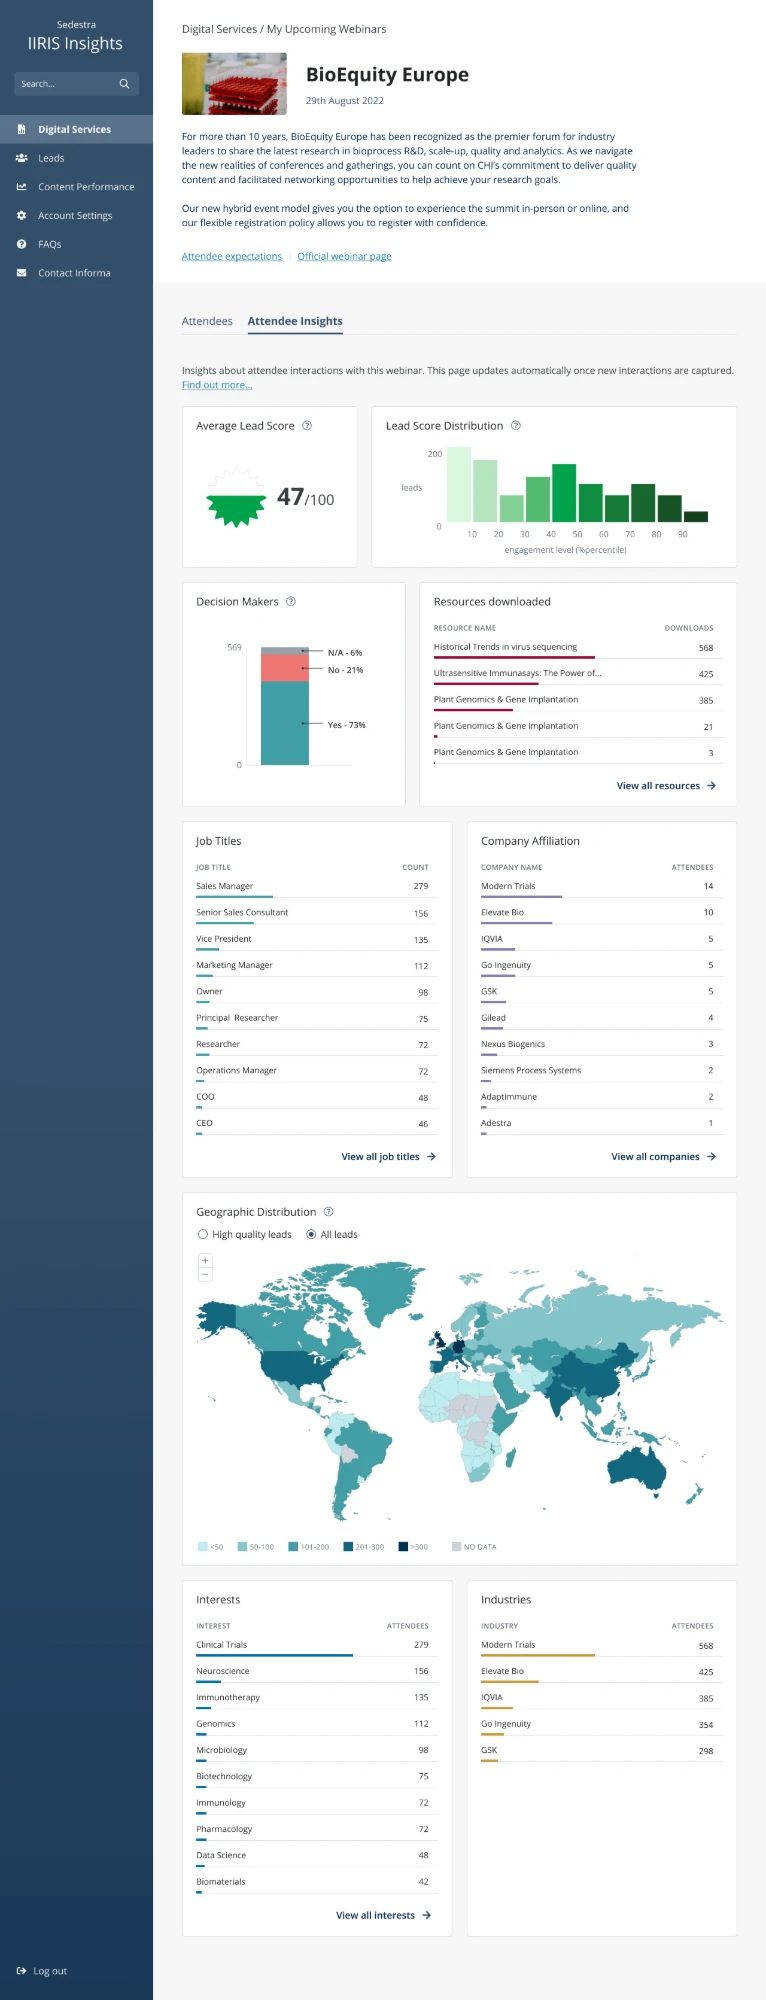
How strong the audience is
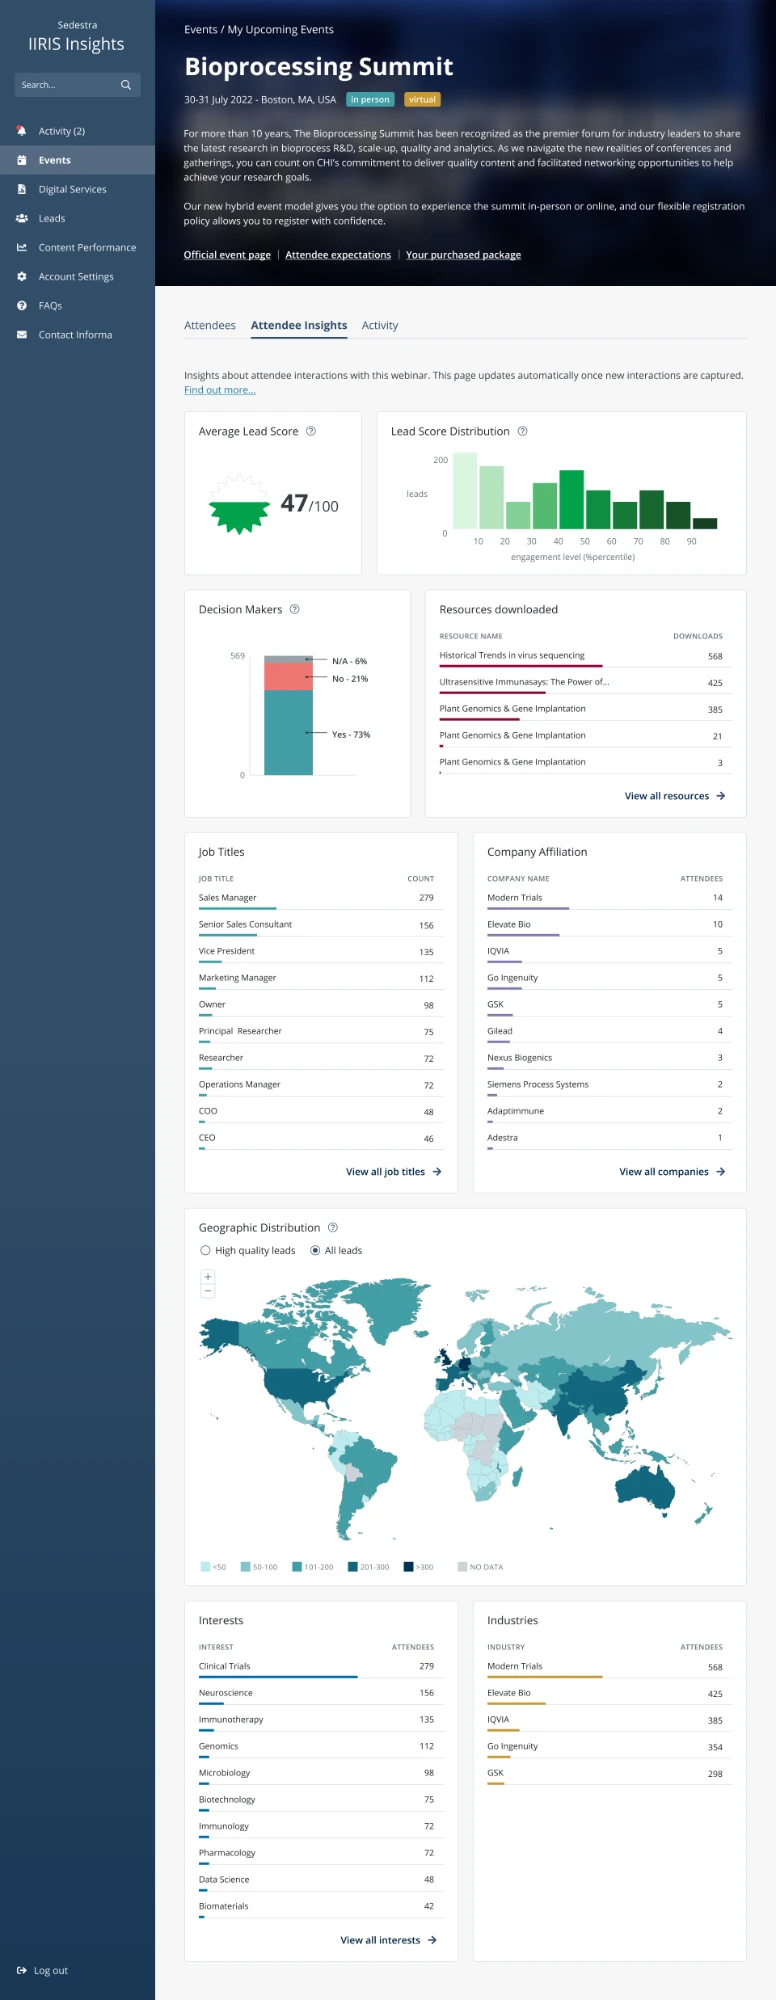
Attendee Insights opens with the average lead score and its distribution for the people at this event, scored for my company, so I see at a glance how strong the audience is.
Decision makers and my resources
How many attendees are decision makers, and which of my company’s resources they downloaded at this specific event.
Who’s showing up
The job titles and companies behind the registrations, to see which roles and accounts this event brings.
Where they’re from
Where attendees come from, to see which regions this event draws.
What they care about
The interests and industries attendees list, to shape follow-up and the content I send.
Activity at this event
How people have interacted with my content at this specific event, with new activity flagged as it comes in.
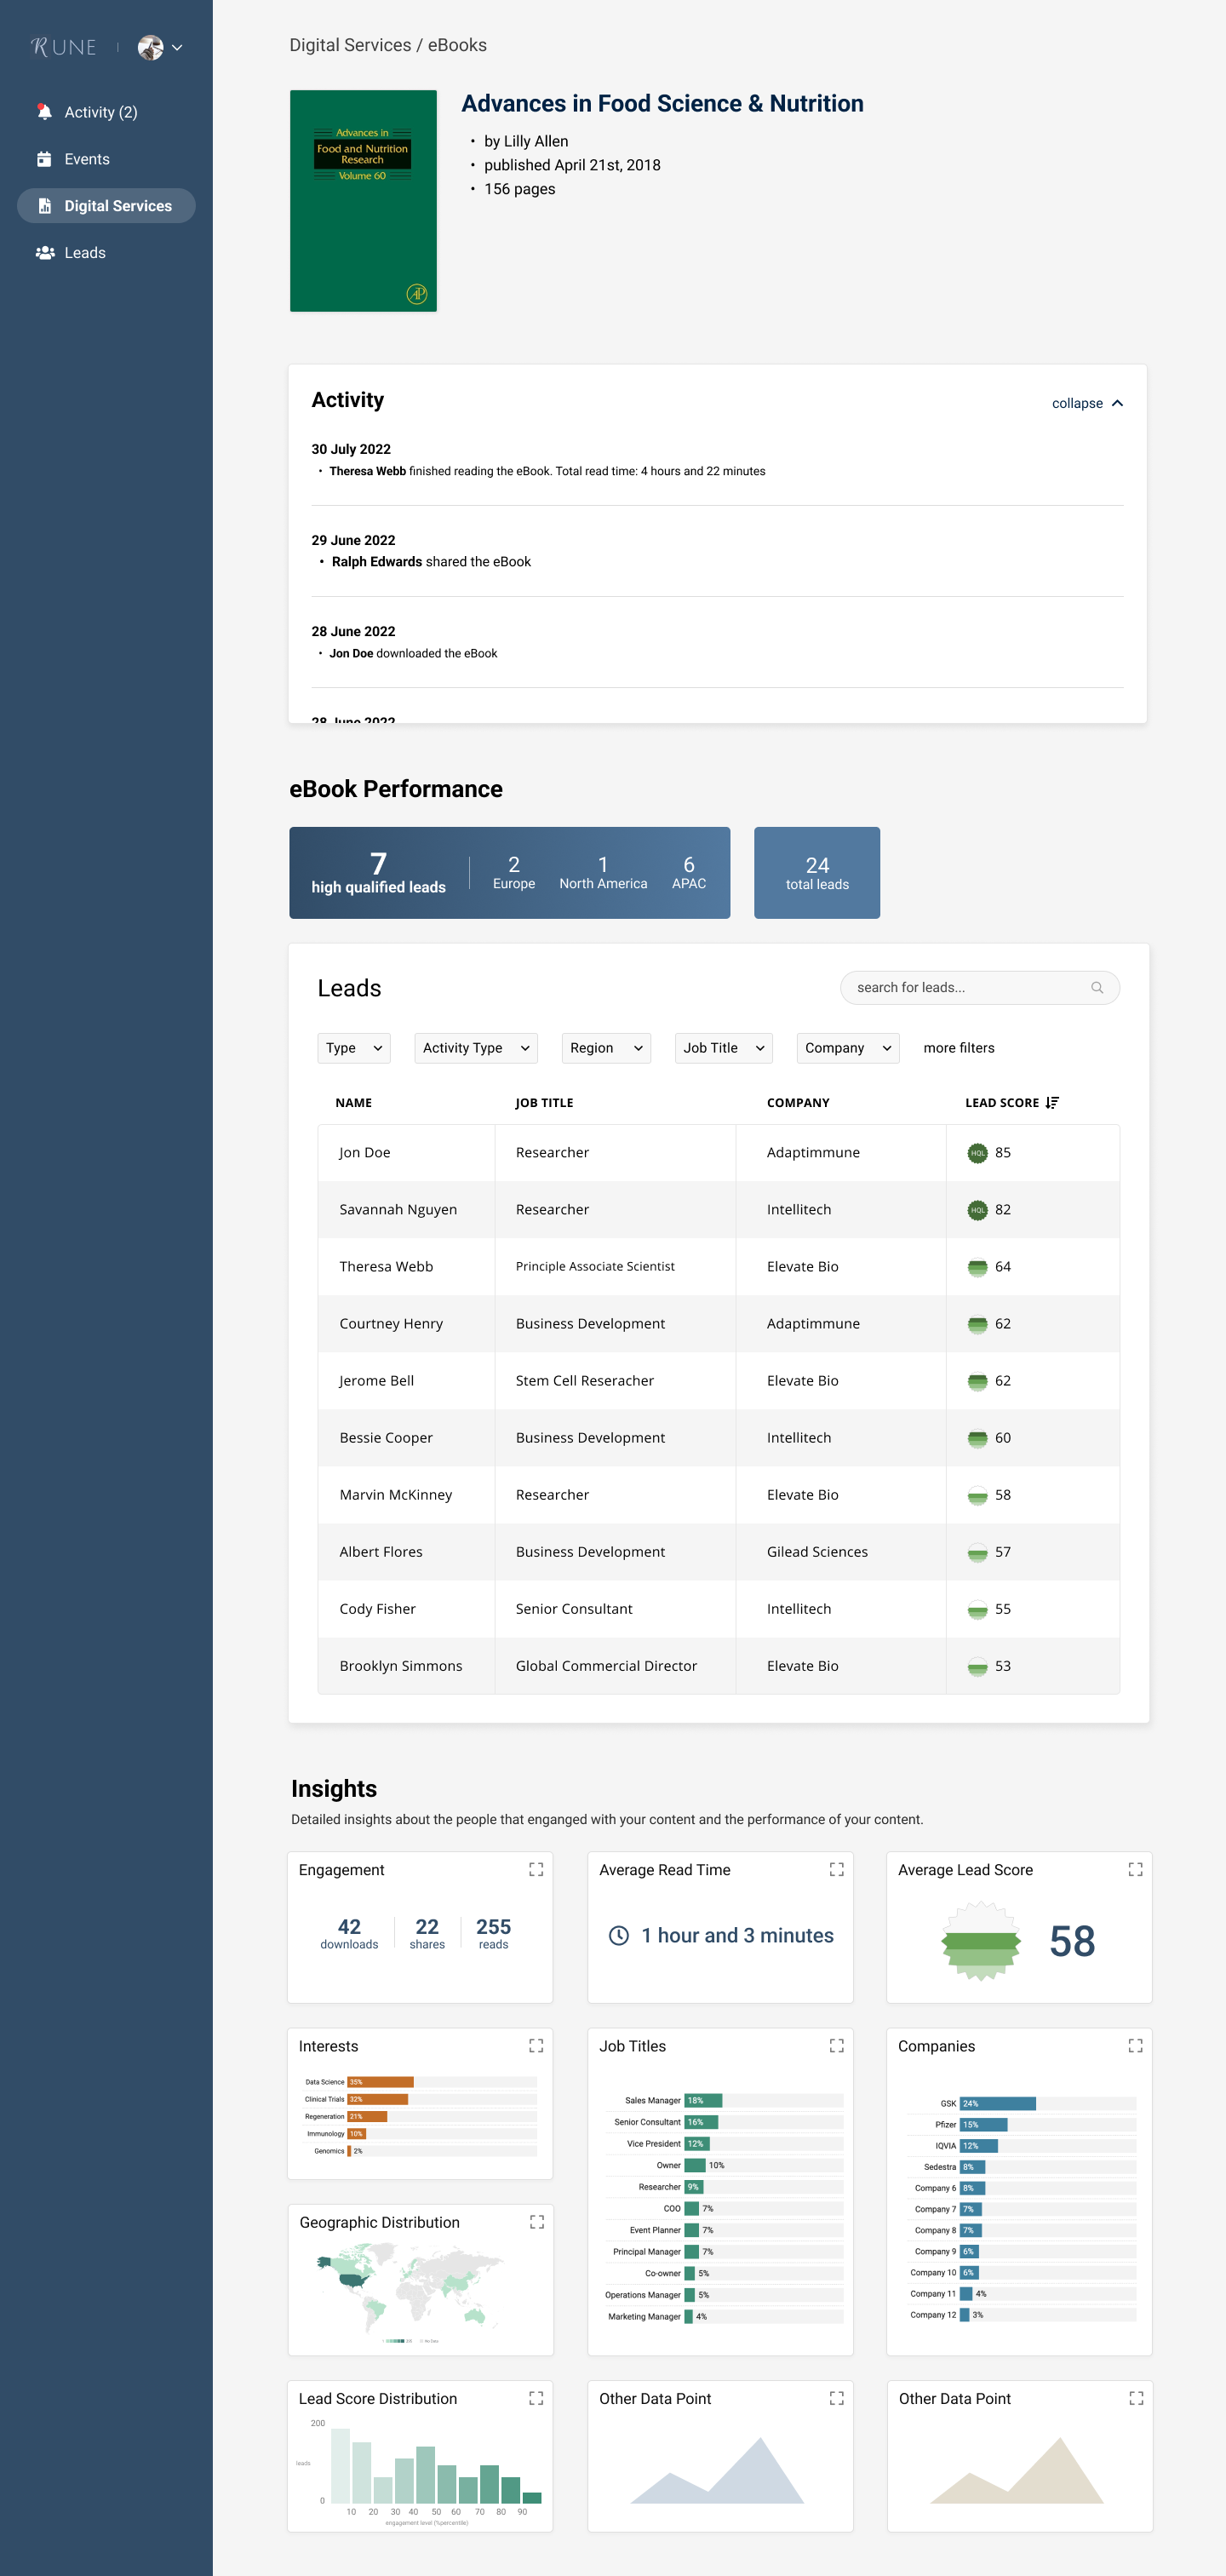
eBooks
Every lead who engaged with an eBook, plus Lead Insights on read time, job titles, companies and regions.
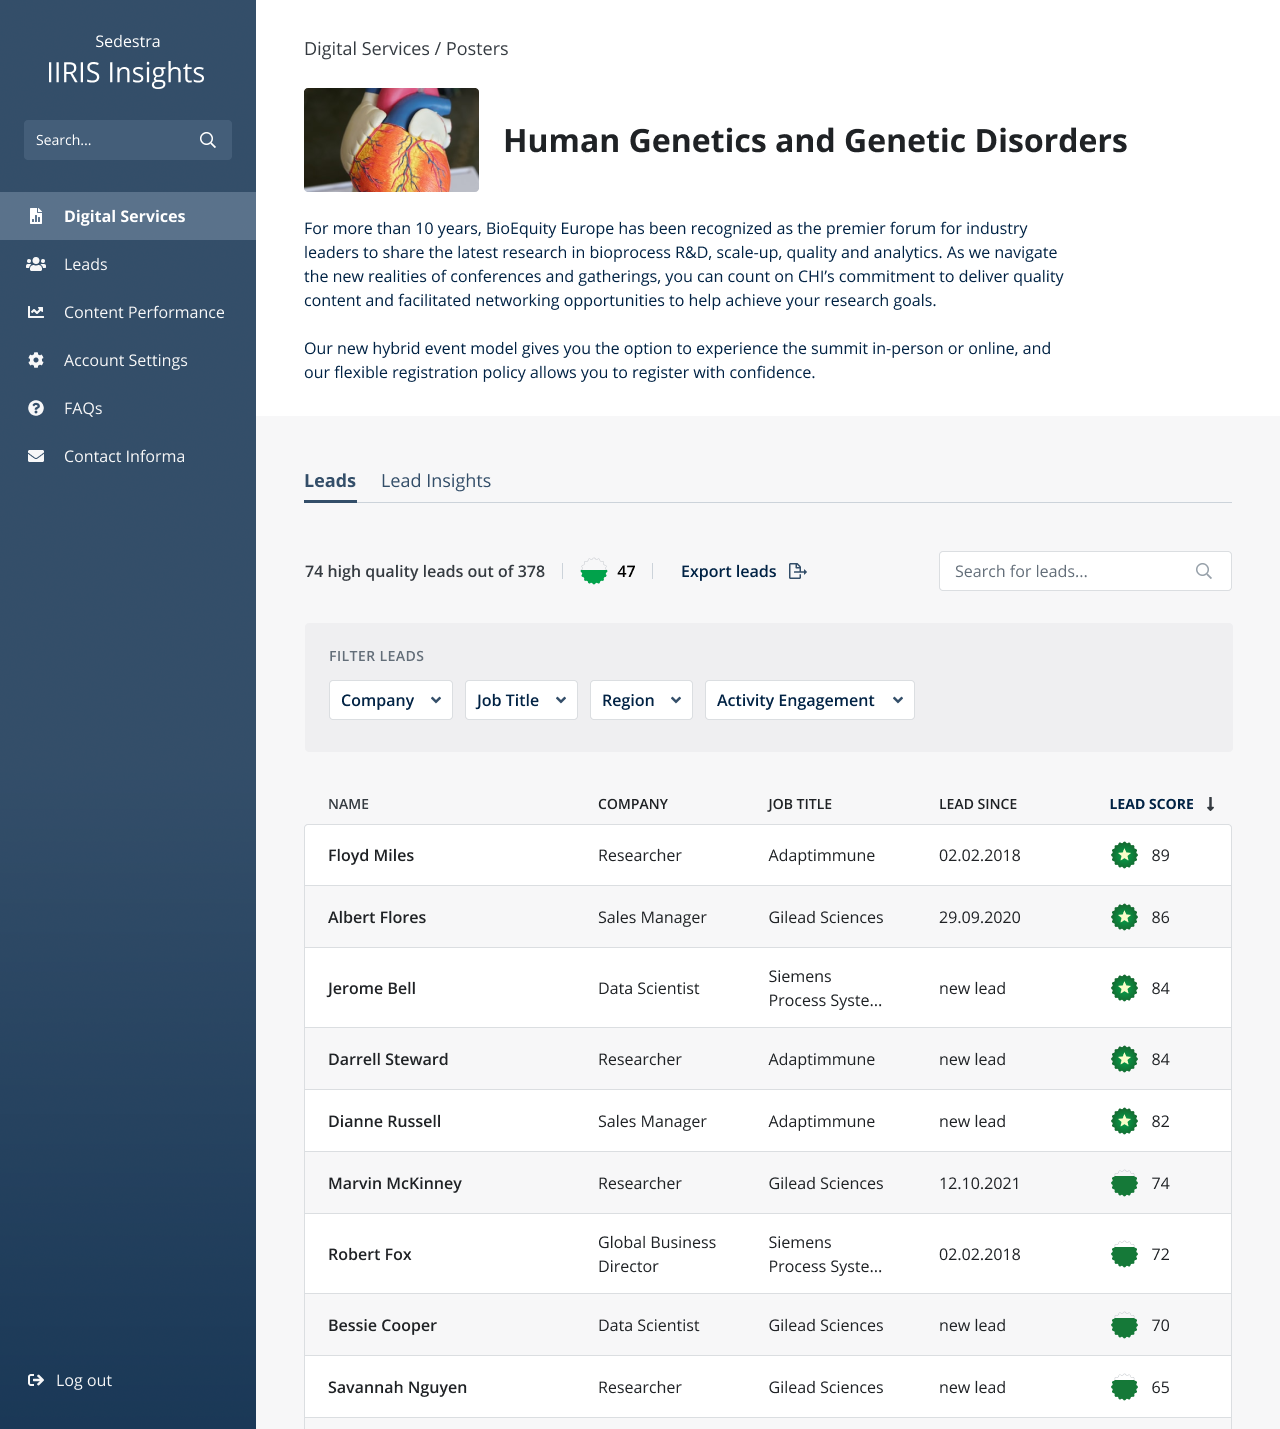
Posters
Every lead who viewed a poster, plus Lead Insights on engagement, job titles, companies and regions.
Webinars
Every attendee who registered for a webinar, plus Attendee Insights on job titles, companies and regions.
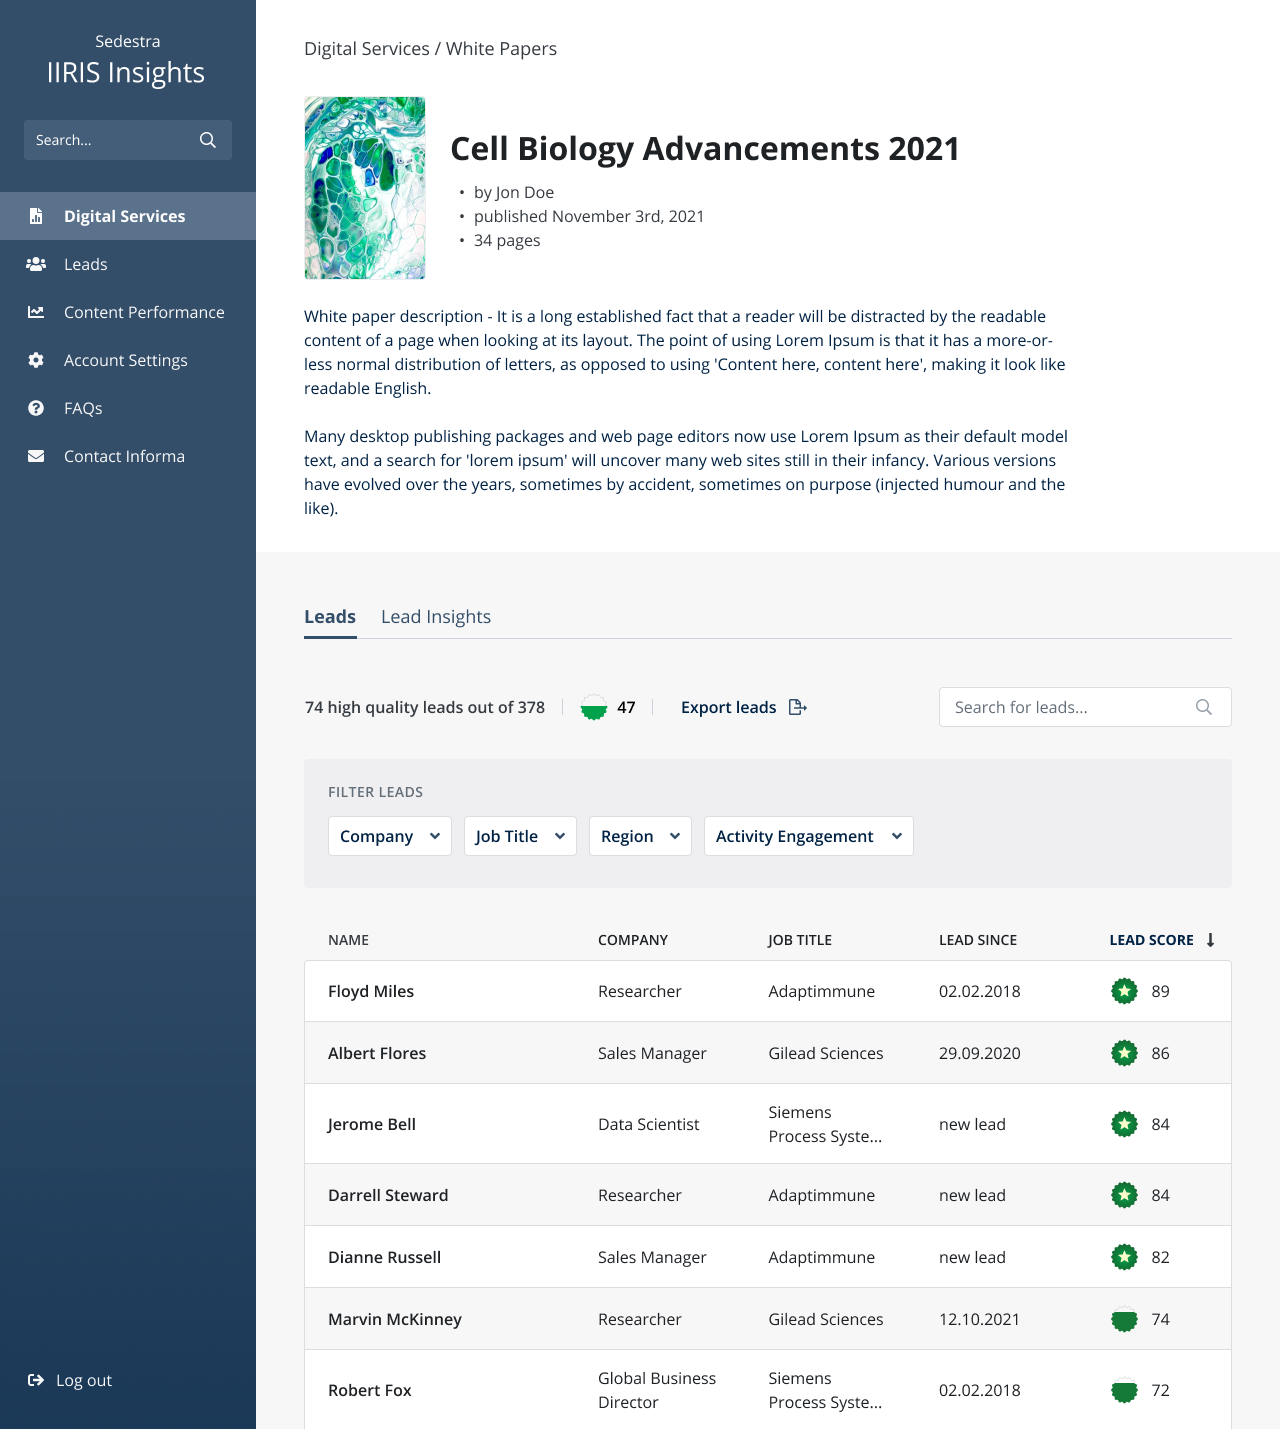
White Papers
Every lead who read a white paper, plus Lead Insights on read time, job titles, companies and regions.
Content Performance
How well my content has been received at past events and through my active and inactive digital services, updated as new interactions are captured.